Trend Analysis:
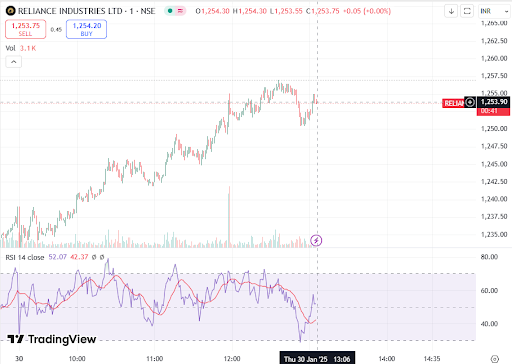
- Uptrend: The price of Reliance Industries Ltd. has been in an upward trajectory for most of the session.
- Recent Consolidation: After a strong move up, there is some consolidation around the 1,253-1,255 range, indicating a potential pause before further movement.
Support & Resistance Levels:
- Support:
- Immediate support: 1,245
- Strong support: 1,235 (previous consolidation zone)
- Resistance:
- Immediate resistance: 1,257-1,260
- Strong resistance: 1,265-1,270 (next breakout level)
Target (TGT) & Stop Loss (SL):
If going LONG (BUY):
- Entry: Above 1,255 for a breakout
- Target (TGT): 1,265 - 1,270
- Stop Loss (SL): 1,245
If going SHORT (SELL):
- Entry: Below 1,250 for breakdown
- Target (TGT): 1,240 - 1,235
- Stop Loss (SL): 1,258
RSI Indicator Insight:
- RSI is currently around 52.07, meaning it's in a neutral zone (not overbought or oversold).
- A drop below 40 on RSI could indicate a bearish trend.
- If RSI crosses above 60, the stock might gain further bullish momentum.
Final Outlook:
- Bullish Bias: If price sustains above 1,255, we can see a continuation towards 1,265-1,270.
- Bearish Breakdown: If the price breaks below 1,250, a decline towards 1,240-1,235 is possible


No comments:
Post a Comment