Technical Analysis View:
Trend Observation:
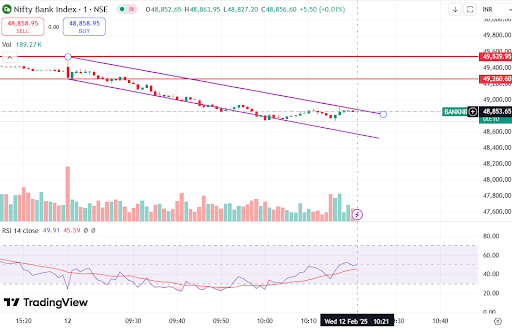
The chart shows a descending channel pattern, indicated by two parallel purple lines. The price is currently attempting to move upward from the lower boundary of the channel.
Support & Resistance Levels:
Support: The lower boundary of the descending channel acts as a dynamic support.
Resistance:
The upper boundary of the channel acts as a short-term resistance.
Horizontal resistance levels marked at 49,260.60 and 49,539.95 are key levels to watch for any breakout.
RSI (Relative Strength Index):
Current RSI is at 49.91, showing neutral momentum but slightly improving. It’s close to the 50-level, which is a key zone to monitor for upward or downward momentum confirmation.
Target & Stop-Loss Based on Technical View:
Target (TGT):
If the price breaks out of the channel to the upside, a potential target would be the 49,260.60 resistance level.
Further upward momentum could push the price to the 49,539.95 level.
Stop-Loss (SL):
A stop-loss can be set slightly below the lower boundary of the channel (around 48,400 or lower), as breaking this level could signal further downside movement.
Strategy Consideration:
Bullish Scenario: If price breaks the upper boundary with volume, a long position with a target of 49,260.60 and a stop-loss near 48,400 is favorable.
Bearish Scenario: If price stays within the channel or breaks below, downside targets could be set, and tighter stop-losses should be considered.
Short-Term, Medium-Term, and Long-Term Views for Nifty Bank Index (Based on the provided chart):
1. Short-Term View (Intraday to 1-2 Days)
Trend: The price is currently trading within a descending channel.
Support & Resistance:
Immediate resistance: Upper channel boundary and 49,260.60.
Support: 48,400 (lower boundary of the channel).
Action:
Bullish: A breakout above the channel could lead to a quick move toward 49,260.60.
Bearish: Failure to break above the channel could lead to a retest of 48,400.
Momentum: RSI near 50 indicates neutral momentum. A move above 50 would signal short-term strength.
Conclusion: Watch for price behavior at the channel boundary and 49,260.60. Short-term targets: 49,260.60 (upside) or 48,400 (downside).
2. Medium-Term View (1 Week to 1 Month)
Trend:
The descending channel suggests a medium-term downtrend.
The index needs to break above 49,260.60 to reverse the downtrend.
Key Levels:
Resistance: 49,260.60 and 49,539.95.
Support: If 48,400 breaks, next support is around 47,800.
Momentum: A break above RSI 50 could strengthen buying pressure for a potential upward move.
Conclusion:
A break above 49,260.60 would shift the medium-term trend to bullish.
Failure to break resistance could lead to a consolidation or further downside.
3. Long-Term View (1 Month and Beyond)
Trend:
The long-term trend will depend on whether the index can hold above 49,260.60 and break 49,539.95.
Sustained price action above 49,500 would signal a potential long-term reversal to bullish.
Bearish Risks: A break below 47,800 could signal further downside, with long-term targets near 46,500.
Key Levels to Watch:
Bullish breakout above 49,500 could push the index toward 50,000+.
Bearish breakdown below 47,800 would signal increased selling pressure.
Summary:
Short-Term: Neutral to slightly bullish, with key resistance at 49,260.60.
Medium-Term: Needs a breakout above 49,260.60 to confirm bullish strength.
Long-Term: Watch for sustained price action above 49,500 to confirm a bullish reversal; otherwise, further downside is possible.


No comments:
Post a Comment