Technical Analysis of Crude Oil Futures (MCX) Chart
Based on the chart, here is the technical breakdown:
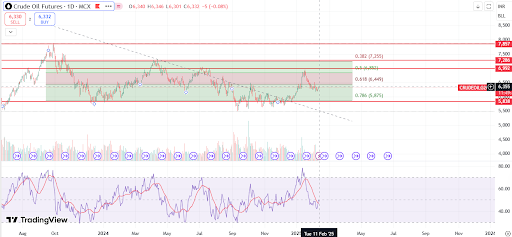
1. Support & Resistance Levels:
- Support Levels:
- 5,875 (0.786 Fibonacci retracement) – Strong support zone.
- 5,838 – Another key support level.
- Resistance Levels:
- 6,449 (0.618 Fibonacci retracement) – Initial resistance.
- 6,852 (0.5 Fibonacci retracement) – Medium resistance.
- 7,255 (0.382 Fibonacci retracement) – Strong resistance.
- 7,286 – 7,857 – Strong supply zone (previous highs).
2. Target Levels:
- If price sustains above 6,449, then the next potential targets are 6,852, 7,255, and 7,286.
- A breakout above 7,286 can take crude oil futures to 7,857 or even higher.
3. Stop Loss:
- If the price falls below 6,300, the next possible stop loss would be 5,875 or 5,838.
- A break below 5,838 can lead to further downside.
4. Technical Indicators:
- Fibonacci Retracement: Indicates key support and resistance zones.
- Trendline Breakout: The chart shows a breakout from a downward trend.
- RSI Indicator (Bottom Panel): Recently overbought, now cooling off – suggesting possible consolidation before another move.
5. Summary & Trading Strategy:
- Bullish Scenario: If crude oil futures sustain above 6,449, expect an upward move towards 6,852 – 7,286.
- Bearish Scenario: If it breaks below 6,300, expect a decline towards 5,875 – 5,838.
- Neutral Bias: If price consolidates in the green zone, it may remain range-bound between 6,300 – 6,450 before making a decisive move.
Crude Oil Futures (MCX) – Short-Term, Medium-Term, and Long-Term Outlook
1. Short-Term View (Few Days to 2 Weeks)
- Bias: Neutral to Slightly Bearish
- Key Levels:
- Support: 6,300 – 6,000
- Resistance: 6,450 – 6,850
- Analysis:
- Price recently rejected resistance near 6,850 (0.5 Fibonacci level).
- RSI is cooling off after an overbought condition, indicating possible consolidation or a pullback.
- If price sustains below 6,300, expect a drop towards 6,000 – 5,875.
- For upside momentum, it needs to reclaim 6,450 – 6,500 convincingly.
🔹 Trading Strategy:
- A short position is favorable below 6,300 with targets at 6,000 – 5,875.
- A long position is favorable if price holds 6,300 – 6,450 and reclaims 6,500, targeting 6,850 – 7,000.
2. Medium-Term View (Few Weeks to 3 Months)
- Bias: Neutral to Bullish
- Key Levels:
- Support: 5,875 – 6,000
- Resistance: 6,850 – 7,286
- Analysis:
- Price has broken out of the downtrend but faces key resistances at 6,850 – 7,286.
- Fibonacci retracement levels suggest a strong supply zone near 7,286.
- A successful retest and hold above 6,449 – 6,500 would confirm medium-term bullish momentum.
🔹 Trading Strategy:
- If crude sustains above 6,500, buying on dips is preferred, targeting 6,850 – 7,286.
- A break below 6,000 could trigger a larger correction towards 5,875.
3. Long-Term View (6 Months to 1 Year+)
- Bias: Bullish
- Key Levels:
- Support: 5,875 – 6,000
- Resistance: 7,286 – 7,857
- Analysis:
- The overall trend is transitioning from bearish to bullish with a breakout attempt.
- A sustained move above 7,286 will signal a long-term uptrend towards 7,857 – 8,000.
- However, failure to break 7,286 could lead to range-bound movement between 5,875 – 7,286.
🔹 Investment Strategy:
- Long-term investors should look for dips near 6,000 – 6,300 for accumulation.
- A breakout above 7,286 confirms bullish continuation towards 8,000.
Final Summary:
| Timeframe | Bias | Key Levels | Strategy |
|---|---|---|---|
| Short-Term (Days to 2 Weeks) | Neutral to Slightly Bearish | 6,300 Support, 6,850 Resistance | Short below 6,300, Buy above 6,500 |
| Medium-Term (Weeks to 3 Months) | Neutral to Bullish | 6,000 Support, 7,286 Resistance | Buy above 6,500 for 7,286 |
| Long-Term (6+ Months) | Bullish | 5,875 Support, 7,857 Target | Buy on dips, Breakout above 7,286 for 8,000 |


No comments:
Post a Comment