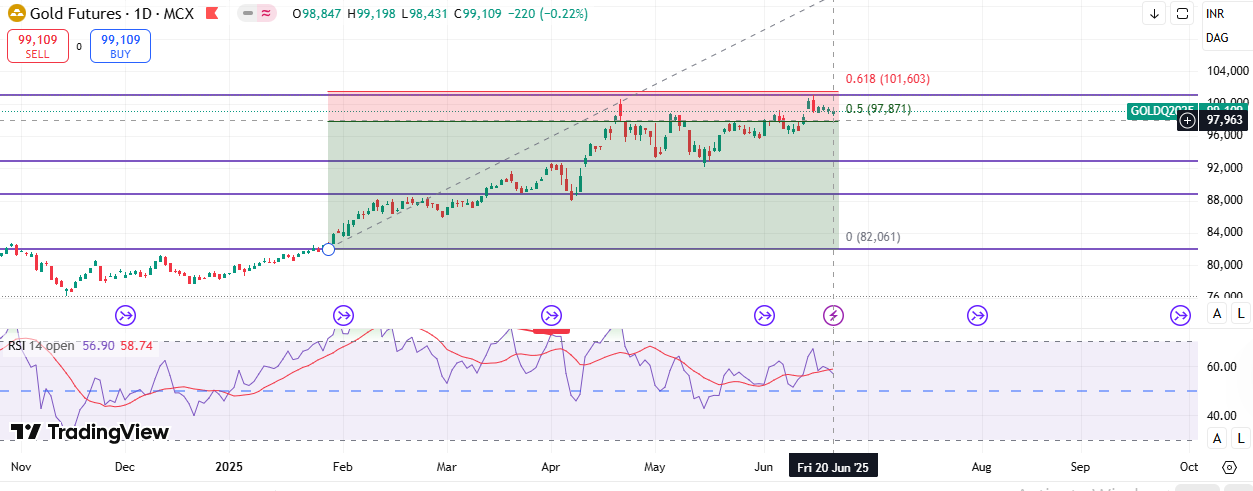
As of February 10, 2025, Motherson Sumi Wiring India Ltd. (MSUMI) is trading at 54.12
Support & Resistance Levels:Support: Immediate support: ₹54.20
Stronger support: ₹53.46
Critical support: ₹50 (psychological level)
Resistance:
Immediate resistance: ₹58.51 (Fibonacci 0.618 level)
Next resistance: ₹61.97 (Fibonacci 0.5 level)
Major resistance: ₹65.15 (Fibonacci 0.382 level)
Strong resistance levels: ₹72.44 & ₹77.33
Trend Analysis:
Downtrend: The stock is in a clear downtrend with lower highs and lower lows.
Descending trendline: Price is consistently getting rejected at the downtrend line.
Fibonacci Retracement Levels: The stock is currently near the 0.786 retracement level (₹53.50), which acts as strong support. If this breaks, a deeper correction is possible.
RSI Indicator: RSI is around 42.75, indicating slight oversold conditions but still not in the extreme oversold zone. A bounce is possible if support holds.
Trading Strategy Based on Timeframe
Short-Term (Few Days to 1 Week)
Target: ₹58.50 – ₹61.90
Stop Loss: ₹53.50 (If this breaks, more downside risk)
Strategy: If the stock holds above ₹54 and breaks the downtrend line, a short-term bounce towards ₹58.50-₹61.90 is possible. However, if ₹53.50 breaks, avoid fresh buying.
Medium-Term (1 to 3 Months)
Target: ₹65.15 – ₹72.44
Stop Loss: ₹50
Strategy: If the stock closes above ₹61.90 (Fibonacci 0.5 level), it can move toward ₹65-₹72. Wait for a trend reversal confirmation.
Long-Term (6+ Months)
Target: ₹72.44 – ₹77.33
Stop Loss: ₹48
Strategy: If the stock sustains above ₹65, it may enter a long-term uptrend towards ₹77.33. Accumulate only if the stock stabilizes above ₹61.90.
Conclusion:
Bearish Trend: The stock is still in a downtrend. Any bounce will need confirmation of a trend reversal.
Short-Term Bounce Possible: If ₹54 holds, it can test ₹58-₹61, but if ₹53.50 breaks, more downside towards ₹50 is likely.
Wait for Confirmation for Long-Term Buy: A break above ₹65-₹72 will confirm a long-term bullish reversal.


No comments:
Post a Comment