From 1 February 2019 to 1 February 2025, Nifty has made highs and lows in this way and even today the market is still down, while on 20/2/2025 the market is also down. If we look at the current and future trends, the trend is still down.
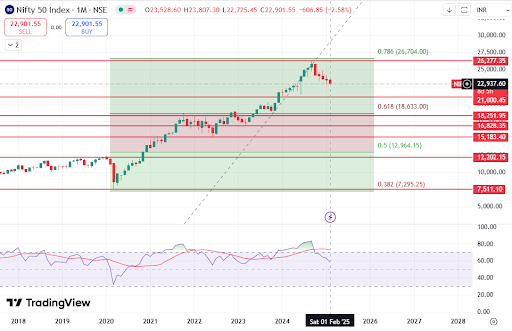
Looking at the chart you provided for the Nifty 50 index, here’s a breakdown based on technical analysis:
Technical Overview
The chart shows key Fibonacci retracement levels, resistance, and support zones, which are crucial for setting target prices and stop losses.
Support and Resistance Levels
Immediate Support: Around 21,000, marked by a key horizontal line.
Next Support Levels:
18,633 (61.8% Fibonacci retracement level)
15,183 (historical support & close to previous lows)
12,964 (50% retracement level, another key long-term support)
Resistance Levels:
23,000 to 23,500 (current resistance zone)
26,277 (previous peak level and strong resistance zone)
26,704 (78.6% Fibonacci level and long-term resistance)
Short-Term View
Current Price Behavior: Nifty 50 is trading just below immediate resistance, indicating potential further downside unless it breaks the 23,000-23,500 zone.
Target: If the index breaks below 21,000, it could target 18,633 in the short term.
Stop Loss: Place a stop loss above 23,500 for any short positions.
Medium-Term View
If the market holds at 21,000, expect consolidation and possible recovery towards 23,500.
Break Below 21,000: Medium-term downside targets could be 18,633 or 15,183.
Upside Potential: If Nifty 50 breaks above 23,500, next resistance would be 26,277.
Long-Term View
As long as 12,964 (50% Fibonacci) holds, the long-term trend remains intact.
A break above 26,277 could trigger a continuation of the bull market.
However, a move below 12,964 could shift the long-term trend to bearish.
Summary
Bullish Above: 23,500
Bearish Below: 21,000
Short-Term Target: 18,633 (if support breaks)
Medium-Term Target: 15,183 or lower
Long-Term Bullish Breakout Level: 26,277
This analysis provides a framework for setting stop losses and targets based on Nifty 50’s price behavior across different timeframes.


No comments:
Post a Comment