Technical Analysis of Nifty 50 (5-Minute Chart)
1. Chart Setup & Indicators:
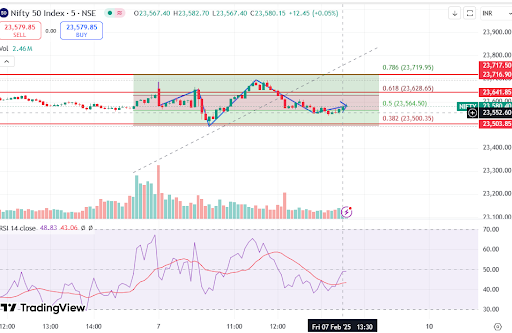
Fibonacci Retracement Levels: Applied on a recent uptrend.
Key Levels:
0.382 (23,500.35) → Support Level
0.5 (23,564.50) → Current price zone
0.618 (23,628.65) → Resistance
0.786 (23,719.95) → Major Resistance
RSI (Relative Strength Index):
Current RSI: 48.83 (Neutral, near 50)
RSI recently bounced from oversold levels (~43), indicating possible recovery.
Volume Analysis:
A spike in volume suggests buying interest near Fibonacci support levels.
2. Expected Move & Trade Plan
Bullish Scenario (If Price Holds Above 23,550-23,564 Zone):
✅ Entry: Above 23,565 (if price sustains)
🎯 Targets:
First Target (T1): 23,628 (0.618 Fib level)
Second Target (T2): 23,717-23,720 (0.786 Fib level)
🛑 Stop-Loss: Below 23,500 (0.382 Fib support)
🔹 Confirmation:
Price breaking above 23,580 with increasing volume.
RSI moving above 50 confirms momentum shift.
Bearish Scenario (If Price Fails at 23,564 & Breaks Below 23,500):
❌ Entry: Below 23,500
🎯 Targets:
First Target (T1): 23,450
Second Target (T2): 23,400
🛑 Stop-Loss: Above 23,565
🔹 Confirmation:
Price closing below 23,500 with strong red candles.
RSI moving below 40 signals weakness.
3. Bias & Final View:
Bullish Bias (As long as price holds above 23,550).
If price breaks 23,580, expect 23,628-23,720 as next resistance levels.
Below 23,500, bearish momentum can take over.
Nifty 50 (5-Min) Chart Analysis
1. Support & Resistance Levels:
📌 Support Levels:
23,550-23,564 → Immediate support (0.5 Fibonacci level)
23,500-23,503 → Strong support (0.382 Fibonacci level)
23,450-23,400 → Major support zone (if breakdown happens)
📌 Resistance Levels:
23,628-23,641 → Immediate resistance (0.618 Fibonacci level)
23,716-23,720 → Strong resistance (0.786 Fibonacci level)
23,800+ → Breakout level for further upside
2. Short-Term View (Intraday to Few Days)
🔹 Bullish Scenario:
If price holds above 23,550, expect a move towards 23,628-23,720.
RSI recovering from oversold levels supports a bounce.
Volume spike indicates buyers stepping in at lower levels.
🔹 Bearish Scenario:
If price breaks below 23,500, expect further downside towards 23,450-23,400.
Weak RSI below 40 confirms bearish momentum.
⏳ Overall Short-Term Bias: Neutral to Bullish (unless 23,500 breaks).
3. Long-Term View (Few Weeks to Months)
📊 Technical Outlook:
Trend: Nifty is still in an uptrend but facing resistance near 23,720-23,800.
Fibonacci Analysis: If Nifty crosses 23,720, it can continue its bullish trend.
Key Breakout Level: 23,800 (Above this, rally can extend towards 24,000+).
Bearish Risk: If Nifty fails to sustain above 23,500, deeper correction towards 23,200-23,000 possible.
⏳ Overall Long-Term Bias: Bullish as long as Nifty stays above 23,500-23,550.
4. Trading Strategy Recommendation
🎯 For Long Positions:
Buy above 23,565-23,580, targets 23,628 / 23,720, SL 23,500.
🎯 For Short Positions:
Sell below 23,500, targets 23,450 / 23,400, SL 23,565.


No comments:
Post a Comment