Technical Analysis of Ashok Leyland (1-Minute Chart)
Support and Resistance Levels:
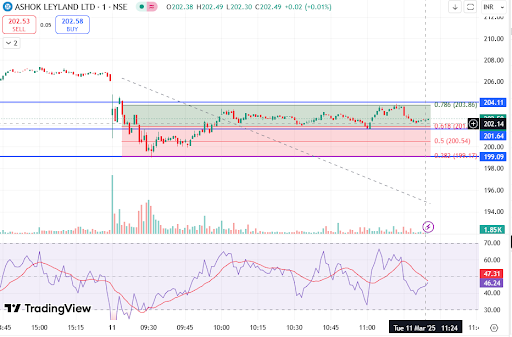
Resistance: 204.11 (Upper blue horizontal line)
Support 1: 201.64 (Intermediate support level near the trendline)
Support 2: 199.09 (Lower blue horizontal line)
Trend and Key Observations:
The price is forming Higher Highs (HH) and Higher Lows (HL), indicating an uptrend.
However, recent Lower Highs (LH) and Lower Lows (LL) suggest possible weakness.
The black ascending trendline is acting as dynamic support.
The price is currently testing the 201.64 support level and the trendline.
Indicators:
RSI (Relative Strength Index):
Current RSI: 41.94 (Approaching the oversold region)
RSI is below 50, indicating weak momentum.
The red signal line crossing above the RSI line suggests bearish momentum.
Trading View:
Bullish Scenario: If the price holds above 201.64 and bounces, it can retest 204.11.
Bearish Scenario: If it breaks below 201.64, a move toward 199.09 is possible.
Target and Stop-Loss:
Entry: Near 202.33, if support at 201.64 holds.
Target: 204.11 (Resistance level)
Stop-Loss: Below 201.64 (Possible 200.50-199.90 to avoid whipsaws)
Conclusion:
Bullish View: If the price stays above 201.64, expect a rebound to 204.11.
Bearish View: A breakdown below 201.64 may lead to 199.09.
RSI suggests cautious trading as momentum is weakening.
Short-Term, Medium-Term, and Long-Term View for Ashok Leyland
1. Short-Term View (Intraday to a Few Days)
📊 Analysis:
Price is trading near the 201.64 support and trendline.
RSI is near 41.94, indicating weak momentum but not yet oversold.
If 201.64 holds, a bounce towards 204.11 is likely.
If it breaks below 201.64, it may drop toward 199.09.
🎯 Short-Term Strategy:
Bullish: Buy near 202, target 204.11, SL at 201.50.
Bearish: Sell below 201.64, target 199.09, SL at 202.50.
Bias: Neutral to slightly bullish if support holds.
2. Medium-Term View (Few Weeks to a Month)
📊 Analysis:
Stock has shown an uptrend but recent price action suggests consolidation.
If it breaks 204.11, further upside toward 207-210 is possible.
A breakdown below 199 could lead to 195-192 levels.
🎯 Medium-Term Strategy:
Bullish: Buy above 204.11, target 207-210, SL 201.
Bearish: Sell below 199, target 195, SL 202.
Bias: Bullish above 204.11, cautious below 199.
3. Long-Term View (Few Months to a Year)
📊 Analysis:
Stock is in a broader uptrend, with higher highs and higher lows on a higher timeframe.
If it sustains above 210, it can rally towards 220-230 in the long run.
A break below 195 would weaken the long-term structure, bringing 180-175 into focus.
🎯 Long-Term Strategy:
Bullish: Buy on dips above 195, target 220-230.
Bearish: Avoid fresh longs if below 195.
📌 Overall View:
Short-term: Range-bound, bullish above 204.11, bearish below 201.64.
Medium-term: Bullish if holding above 204, cautious below 199.
Long-term: Positive outlook unless it breaks 195.


No comments:
Post a Comment