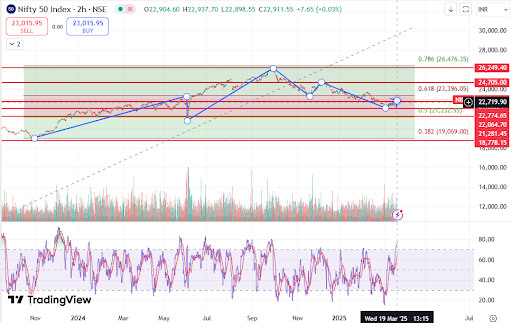
This chart represents the Nifty 50 Index on a 2-hour timeframe, and it includes multiple technical analysis elements such as Fibonacci retracement levels, support and resistance zones, trendlines, and indicators (like RSI and volume). Here’s an analysis of the target and stop-loss based on these factors:
1. Key Levels and Fibonacci Retracement:
0.786 Fibonacci Level (26,476.35) → Strong resistance and potential upside target.
0.618 Fibonacci Level (23,396.05) → A crucial resistance level where price action might face selling pressure.
0.5 Fibonacci Level (21,232.35) → A key support level that might act as a buffer in case of a downturn.
0.382 Fibonacci Level (19,069.00) → A deep correction support level in case of strong bearish momentum.
2. Support and Resistance:
Strong resistance levels: 24,705.00 and 26,249.40 (shown by red zones).
Key support levels: 22,774.65, 22,064.70, 21,281.45 (marked in red zones below current price).
3. Target and Stop-Loss Based on Technical Analysis:
If Taking a Long Position (Bullish View):
Entry: Around 22,719.90 (current market price).
Target 1: 23,396.05 (0.618 Fib level, key resistance).
Target 2: 24,705.00 (major resistance zone).
Final Target: 26,249.40 - 26,476.35 (0.786 Fibonacci level).
Stop-Loss: Below 22,064.70 (key support breakdown).
If Taking a Short Position (Bearish View):
Entry: Near resistance around 23,396 - 24,705.
Target 1: 22,774.65 (first key support).
Target 2: 21,232.35 (0.5 Fibonacci support).
Final Target: 19,069.00 (0.382 Fibonacci retracement level).
Stop-Loss: Above 24,705.00 (if resistance breaks).
4. Indicators Supporting the Analysis:
RSI (Relative Strength Index) at the bottom shows an oversold bounce and has moved upwards, which may indicate some bullish momentum.
Volume shows a spike, which could confirm a potential reversal or breakout.
Trendline Analysis: The market has followed a downward trend, but a bounce is forming at key support.
Conclusion:
For Bulls: If price sustains above 22,700, targets are 23,396, 24,705, and 26,249.
For Bears: If resistance holds, downside targets are 22,774, 21,232, and 19,069.
Risk Management: Use a stop-loss below strong support to minimize downside risk.
Here's a short-term, medium-term, and long-term outlook for the Nifty 50 Index based on the technical chart:
1. Short-Term View (Next Few Days to Weeks) – Neutral to Bullish
🔹 Current Trend: The price is consolidating around 22,719.90, near a key support zone.
🔹 Key Resistance: 23,396 (0.618 Fibonacci) & 24,705
🔹 Key Support: 22,774 & 22,064
🔹 RSI Indicator: Rising from oversold levels, suggesting a possible short-term bounce.
🔹 Short-Term Target:
Bullish case: If Nifty holds above 22,700, it may test 23,396 – 24,705.
Bearish case: If 22,700 breaks, it may drop to 22,064 – 21,232.
🔹 Short-Term Trade Setup:
Buy above 22,700 for 23,396 / 24,705 (Stop-loss: 22,064).
Sell near 23,396 – 24,705 for 22,774 / 21,232 (Stop-loss: above 24,705).
2. Medium-Term View (Next Few Months) – Cautiously Bullish
🔹 Trend Analysis:
Nifty has seen a strong uptrend but is currently in a corrective phase.
A breakout above 24,705 will confirm a resumption of the uptrend.
A breakdown below 21,232 can lead to deeper corrections.
🔹 Medium-Term Key Levels:
Resistance: 24,705 – 26,249
Support: 21,232 – 19,069
🔹 Medium-Term Target:
Bullish case: If Nifty breaks 24,705, it may reach 26,249 – 26,476.
Bearish case: If it breaks 21,232, it may drop to 19,069 (0.382 Fibonacci).
🔹 Medium-Term Trade Setup:
Buy on dips above 22,000 for 24,705 / 26,249.
Sell below 21,232 for 19,069 (Stop-loss: above 22,700).
3. Long-Term View (6+ Months to 1 Year) – Strongly Bullish
🔹 Structural Trend:
Nifty remains in a long-term bull market with higher highs & higher lows.
Fibonacci retracements indicate a long-term target of 26,476+.
🔹 Long-Term Key Levels:
Support: 19,069 – 21,232
Resistance: 26,249 – 28,000+
🔹 Long-Term Target:
If 26,249 breaks, the next level is 28,000+.
If Nifty falls below 19,069, a deeper correction to 18,000 could happen.
🔹 Long-Term Trade Setup:
Buy on dips towards 21,232 – 22,700 for long-term targets of 26,249 – 28,000.
Final Summary:
✅ Short-Term: Watch 22,700; upside to 23,396 – 24,705, downside to 22,064.
✅ Medium-Term: Holding 22,000+ targets 24,705 – 26,249.
✅ Long-Term: Bullish above 21,232, next targets 26,249 – 28,000+.


No comments:
Post a Comment