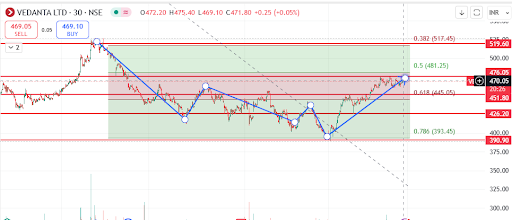
The chart provided is a 30-minute chart of Vedanta Ltd (NSE), featuring Fibonacci retracement levels, support & resistance zones, and price action analysis. Let's break it down:
1. Key Levels Identified
-
Resistance Levels:
-
481.25 (0.5 Fibonacci level)
-
517.45 (0.382 Fibonacci level)
-
519.60 (Major resistance zone from the past trend)
-
-
Support Levels:
-
445.05 (0.618 Fibonacci level - important retracement support)
-
426.20 (Strong price action-based support)
-
393.45 (0.786 Fibonacci level - deep retracement zone)
-
2. Trade Strategy
Bullish Trade Setup (Buy Side)
-
Entry: If the price breaks and sustains above 476-481.25
-
Target 1: 517-519 (major resistance)
-
Stop Loss: Below 445 (0.618 retracement level)
-
Reason: The price has formed a double-bottom-like structure and is currently retesting resistance at Fibonacci 0.5 level (481.25). A breakout could push it higher.
Bearish Trade Setup (Sell Side)
-
Entry: If the price fails to break 481-485 and starts rejecting downward
-
Target 1: 445 (0.618 Fib level)
-
Target 2: 426 (strong support level)
-
Stop Loss: Above 485
-
Reason: If the price gets rejected at 481.25, it may indicate weakness and a potential downward move towards the 0.618 level (445.05).
3. Trend Analysis
-
Short-Term Trend: Bullish (Higher highs and higher lows forming)
-
Long-Term Trend: Still needs confirmation; breaking 481-485 will confirm bullish continuation
4. Final Decision – Which Side to Trade?
-
If price breaks above 481 and sustains → Buy for a target of 517
-
If price rejects 481 and falls below 470 → Sell for a target of 445
Conclusion
-
Watch for breakout or rejection at 481.25 to decide the trade direction.
-
Risk-Reward Ratio: Ensure at least 1:2 risk-reward before entering the trade.
Vedanta Ltd (NSE) – Technical Analysis & Trend View
The stock is currently at ₹471.80 and is approaching a key Fibonacci resistance level at 481.25. Below is the breakdown of the short-term, medium-term, and long-term trends with technical analysis.
1. Trend Analysis & View
🔹 Short-Term Trend (Intraday to 1 Week) – Bullish with Resistance Ahead
-
Current Price Action: The stock has been making higher highs and higher lows, indicating a bullish trend.
-
Resistance Zone: 481.25 (0.5 Fibonacci level)
-
Support Zone: 445.05 (0.618 Fibonacci level)
-
Trade View:
-
If price breaks above 481 and sustains, expect a rally towards 500-519.
-
If rejected at 481, price could pull back towards 445.
-
✅ Short-Term Bias: Bullish, but resistance at 481.25 is critical.
🔹 Medium-Term Trend (Few Weeks to Few Months) – Bullish but Needs Confirmation
-
Uptrend Confirmation: A closing above 481 will confirm a medium-term uptrend.
-
Target: If price sustains above 481, it could reach 517-520.
-
Support: 445 & 426 are crucial support levels to watch.
-
Risk: If price fails to hold above 445, then selling pressure could drag it to 426-400 levels.
✅ Medium-Term Bias: Cautiously Bullish; needs a breakout above 481 for further upside.
🔹 Long-Term Trend (6 Months to 1 Year) – Consolidation with Possible Upside
-
Major Resistance: 519-520 is a strong resistance. Breaking this level could push the stock towards 550-580 in the long run.
-
Support for Long-Term Investors: 390-400 is a strong long-term demand zone.
-
Bearish Risk: If price falls below 390, then long-term bearishness will be confirmed.
✅ Long-Term Bias: Neutral to Bullish. Needs a breakout above 520 for a strong uptrend.
2. Technical Indicators & Patterns
-
📉 Fibonacci Levels: Price is near the 0.5 retracement (481.25), which is a critical level for trend direction.
-
📊 RSI (Relative Strength Index): If RSI is above 60, it indicates strong momentum. If RSI starts declining near 481, a reversal is possible.
-
📈 Moving Averages:
-
50 EMA (short-term) → Price is above it, bullish.
-
200 EMA (long-term) → If price stays above it, bullish confirmation.
-
-
📊 Price Pattern: Forming a W-bottom or inverse head & shoulders, which is bullish if it breaks 481.
3. Trading Strategy
Bullish Trade (If 481 Breaks)
📌 Entry: Above 481
🎯 Target: 500-519
❌ Stop Loss: Below 470
Bearish Trade (If Price Fails at 481)
📌 Entry: Below 470
🎯 Target: 445-426
❌ Stop Loss: Above 485
Final Verdict: What to Do?
✅ Short-Term → Bullish, but watch for a breakout above 481.
✅ Medium-Term → Bullish if 481 holds, cautious if rejected.
✅ Long-Term → Neutral to Bullish, but 520 breakout is needed for strong upside.
💡 Suggestion: Watch price action near 481-485 for direction. If it breaks, go long; if rejected, short-term selling pressure could emerge.


No comments:
Post a Comment