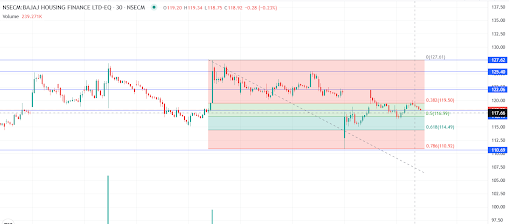
Here's a technical breakdown of the Bajaj Housing Finance Ltd. chart (30-minute timeframe), with a focus on targets, stop-losses, support/resistance, and views for short-, medium-, and long-term perspectives, using Fibonacci retracement and price action:
🔍 Chart Analysis Summary: 📉 Trend: Short-Term Trend: Downtrend, as visible from the Fibonacci drawn from recent swing high (~127.61) to swing low (~110.69).
Recent Action: A bounce from the 0.786 retracement (110.92) back to the 0.382-0.5 zone, indicating possible consolidation or reversal attempt.
📌 Key Fibonacci Levels (Support/Resistance): Resistance Levels:
119.50 (0.382 Fib): Acting as immediate resistance.
122.06: Strong horizontal resistance, tested multiple times.
125.40: Previous major support turned resistance.
127.62 (Fib origin): Major resistance and previous swing high.
Support Levels:
116.99 (0.5 Fib): Currently trying to hold this level.
114.49 (0.618 Fib): Strong support, bounce area.
110.92 (0.786 Fib): Key demand zone; break below may lead to further downside.
110.69: Horizontal support aligned with 0.786 Fib.
🎯 Target and Stop Loss Strategy: For Long (Bullish) Position: Entry Zone: Near 117-118, if price sustains above 116.99.
Targets:
Target 1: 119.50 (0.382 Fib)
Target 2: 122.06 (resistance)
Target 3: 125.40 (extended target)
Stop Loss: Below 114.49 (just under 0.618 Fib for cushion)
For Short (Bearish) Position: Entry Zone: Near 119.50-120 rejection
Targets:
Target 1: 116.99 (Fib support)
Target 2: 114.49
Target 3: 110.92
Stop Loss: Above 122.06 (horizontal resistance)
📅 View Based on Time Horizon: 📆 Short-Term (Intraday to few days): Bias: Neutral-to-bearish unless price decisively closes above 119.50.
Strategy: Watch 116.99-117 zone. Break below = bearish, hold = potential short squeeze.
⏳ Medium-Term (1–2 weeks): Bias: Cautious bullish if price sustains above 119.50 and breaks 122.06.
Target Zone: 125.40 area.
Risk: Falling back below 114.49 invalidates upside.
🕰️ Long-Term (2+ weeks to months): Bias: Still needs confirmation. Only above 127.62 would reinitiate a bullish long-term trend.
Below 110.69: Would signal a structural breakdown and shift to long-term bearish.
🧠 Final Thoughts: Currently, the stock is in a pullback or base-forming phase after a sharp fall.
Consolidation between 114.5–122.0 is crucial — breakout in either direction will decide the next big move.
Use volume spikes and confirmation candles around key levels to enter or exit.


No comments:
Post a Comment