Bank of India BUY 110-118 TARGET 125 /136/155 SL 92 POSITION CALL 4/4/2025
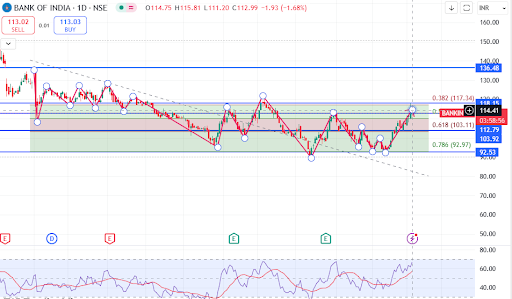
Technical Analysis of Bank of India (Daily Chart)
- Key Support & Resistance Levels Resistance Levels:
118 - 120 Zone: Price is currently near this resistance. If it breaks above, the next target could be 136.48.
136.48: A strong resistance level from previous price action.
Support Levels:
103 - 104 Zone: This is the 0.618 Fibonacci retracement level, which is a strong support.
92.97: The 0.786 Fibonacci level, acting as another key support.
- Target & Stop-Loss Based on Technicals Target (Upside Potential): If the price breaks above 118, the next target is 136.48.
Stop-Loss (Risk Management): If the price falls below 112-113, then the stop-loss should be around 103, which is near the 0.618 Fibonacci support level.
- Indicators Analysis RSI (Relative Strength Index): The RSI indicator at the bottom suggests overbought/oversold conditions. If RSI is over 70, it may indicate a possible pullback.
Fibonacci Retracement: The price is currently around 0.382 Fibonacci level, meaning it may either break out or retrace.
Trading Strategy Breakout Trade: If price closes above 118, enter a buy trade with a target of 136.48.
Support Bounce Trade: If price pulls back to 103-104 and holds, it can be a good buy entry with a target of 118.
Stop-Loss Placement:
For breakout trades above 118, a stop-loss around 112-113 is reasonable.
For support bounce trades at 103, stop-loss should be below 92.5.
Technical View of Bank of India (BOI) Stock (Short, Medium & Long-Term) 📌 Short-Term View (Few Days to a Few Weeks) Trend: Bullish but Facing Resistance The price is near the 118 resistance level (0.382 Fibonacci retracement).
If it breaks above 118, the next short-term target is 125-130.
Support: 112-113 zone. If price falls below this, expect a dip to 103-104 (0.618 Fibonacci).
RSI is near overbought – a potential pullback might happen before a breakout.
✅ Short-term Strategy:
Bullish: Buy if price breaks 118, with a target of 125-130, stop-loss at 112.
Bearish: If price fails to break 118 and reverses, sell with a target of 103, stop-loss above 120.
📌 Medium-Term View (Few Weeks to Few Months) Trend: Sideways to Bullish The price is stuck in a range between 103-118.
A breakout above 118 could lead to 136 (strong previous resistance).
Fibonacci Levels:
0.618 (103) is strong support. If this breaks, trend turns bearish.
0.382 (117-118) is key resistance.
✅ Medium-term Strategy:
Bullish: Buy if price breaks 118, target 136, stop-loss 112.
Neutral: If price stays in 103-118 range, trade between support and resistance.
Bearish: If price falls below 103, expect a decline to 92-93.
📌 Long-Term View (Months to Years) Trend: Bullish if Above 118, Bearish Below 103 Long-term trend depends on breakout levels.
A break above 136 could open doors for 150+ levels.
Strong support is at 92-93 (0.786 Fibonacci) – a breakdown below this can turn long-term bearish.
✅ Long-term Strategy:
Bullish: Buy above 136, target 150-160.
Bearish: If price drops below 92, long-term downtrend starts.
📊 Conclusion: Term Trend Key Levels Strategy Short-Term Bullish, but at Resistance Support: 112-113, Resistance: 118 Buy above 118, Sell below 112 Medium-Term Sideways to Bullish Range: 103-118, Breakout Target: 136 Trade range or buy breakout Long-Term Bullish above 136, Bearish below 92 Major Support: 92, Major Resistance: 136 Buy above 136 for 150+, sell below 92 🔥 Final Tip: Watch 118 level closely – a breakout can lead to a strong rally.
Keep a stop-loss at 112-113 to manage risk.
RSI suggests a potential pullback, so be cautious of false breakouts.


No comments:
Post a Comment