LONG TERM BUY IT THE STOCK Infosys Ltd BUY 1492-1510 TARGET 1550/1643/1795/2008 SL 1360
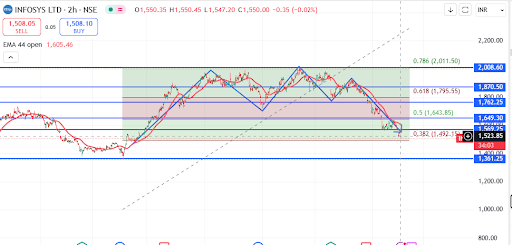
The chart provided is a 2-hour timeframe of Infosys Ltd (NSE) and contains multiple technical indicators such as support/resistance levels, Fibonacci retracement levels, trendlines, and an EMA (44-period). Below is a breakdown of targets, stop-loss levels, and support/resistance zones with a short-term, medium-term, and long-term view.
Technical Analysis Breakdown Support & Resistance Levels
Support Levels:
1,492 (38.2% Fibonacci retracement)
1,361 (Key support zone, long-term)
Resistance Levels:
1,643 (50% Fibonacci retracement)
1,795 - 1,870 (61.8% Fibonacci retracement, major resistance)
2,008 - 2,011 (Strong resistance at 78.6% Fibonacci level)
Trend Analysis
The stock has formed a double-top pattern, followed by a sharp decline.
Currently consolidating near 1,492, suggesting potential reversal or breakdown.
The EMA 44 at 1,605 acts as a dynamic resistance.
Fibonacci Retracement Levels
1,492 (38.2%) - If this level holds, an upward bounce is likely.
1,643 (50%) - First upside target in case of reversal.
1,795-1,870 (61.8%) - Key resistance zone.
Short-Term View (Few days to weeks) Bullish Case: If the price holds above 1,492 and reclaims 1,523-1,550, a move towards 1,643 is possible.
Bearish Case: If the stock breaks below 1,492, it can fall towards 1,361, which is a strong long-term support.
Stop-Loss: Below 1,480 for long positions.
Target: 1,550-1,643 on the upside.
Medium-Term View (Few weeks to months) Bullish Scenario: If the price sustains above 1,643, then 1,795-1,870 is the next major resistance.
Bearish Scenario: Below 1,492, further downside to 1,361 or lower.
Stop-Loss: Below 1,460 for positional longs.
Target: 1,795-1,870 (if reversal happens).
Long-Term View (Months to a year) Bullish: If 1,870 is crossed, the long-term target could be 2,008-2,011 (78.6% Fibonacci retracement).
Bearish: If 1,361 is broken, long-term weakness may continue.
Stop-Loss: Below 1,350 for long-term investors.
Target: 2,008-2,011 (If sustained rally occurs).
Conclusion Short-term traders: Watch 1,492 as key support. Breakout above 1,550-1,560 can trigger a move to 1,643.
Medium-term traders: Need a confirmation above 1,643 for a move towards 1,795.
Long-term investors: If 1,870 is crossed, a rally to 2,000+ is possible.


No comments:
Post a Comment