SECONGD TARGET DONE IT MAKE HIGH 201
FIRST TARGET DONE IT MAKE HIGH 195
Zuari Agro Chemicals BUY ABOVE 189- 190 TGT 195/ 200/205//220 SL 180
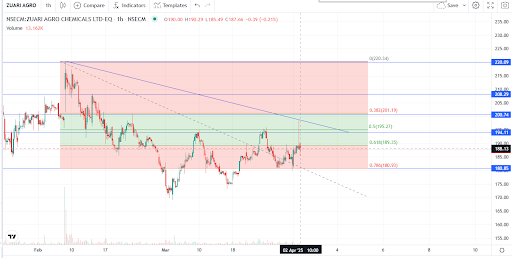
Technical Analysis of Zuari Agro Chemicals (1H Chart)
- Key Levels Identified: Support Levels:
180.85: Strong support based on historical price action and Fibonacci 0.786 retracement level.
185.00 - 188.00: Minor support zone where price has shown rejection multiple times.
Resistance Levels:
189.35: Fibonacci 0.618 retracement, acting as near-term resistance.
194.11: Intermediate resistance level.
200.74 - 201.19: Major resistance around Fibonacci 0.382 retracement and previous price reaction zone.
208.29 - 220.09: Strong long-term resistance levels.
- Trend & Technical Outlook: The stock has been in a downtrend but is attempting a recovery.
The descending trendline is acting as resistance.
Fibonacci retracement levels indicate that the price is facing rejection near 189-195 zone.
A break above 195 will be bullish, while rejection could push the price back to 180-185 zone.
Trading Strategy & Levels: Short-Term View (1-2 weeks): Target: 195 - 200
Stop Loss: Below 185
Buy Trigger: Above 189-190 on strong volume.
Sell Trigger: Rejection at 194-195 or breakdown below 185.
Medium-Term View (1-3 months): Bullish Scenario: If price sustains above 200-201, it can test 208-220.
Bearish Scenario: If price breaks below 180, a further drop to 170-175 is likely.
Long-Term View (3+ months): Needs a breakout above 220 for strong upside potential.
If fails to hold 180, long-term weakness can push it below 160.
Conclusion: Short-term traders: Buy above 190 for a target of 195-200 with a stop loss at 185.
Medium-term traders: Watch for a breakout above 200 to aim for 208-220.
Long-term investors: Should wait for confirmation above 220 or accumulate at 180 support for better risk-reward.


No comments:
Post a Comment