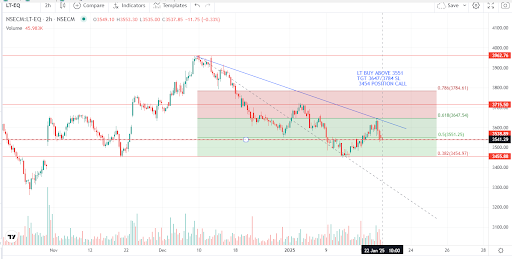
This chart shows a technical analysis of Larsen & Toubro (LT) on a 2-hour time frame. Here's the analysis based on the provided chart:
Key Observations:
Fibonacci Levels:
The stock retraced between the 0.382 and 0.618 Fibonacci levels, indicating a potential support zone.
Trend Line: A descending trend line suggests a bearish bias until the breakout.
Buy Setup:
Suggested entry above ₹3551.
Targets: ₹3647 (0.618 level) and ₹3784 (0.786 level).
Stop Loss: ₹3454 (below the 0.382 level).
Short-Term View:
Bullish Potential: If the stock breaks above ₹3551 and sustains, it could head toward the mentioned targets.
Bearish Risks: If the stock closes below ₹3454, the bearish trend may continue.
Long-Term View:
For a long-term perspective:
Sustained trading above ₹3784 (0.786 Fibonacci level) would indicate a stronger recovery.
Below ₹3454, the stock could re-test lower levels near ₹3200 or ₹3100.


No comments:
Post a Comment