Intraday View:
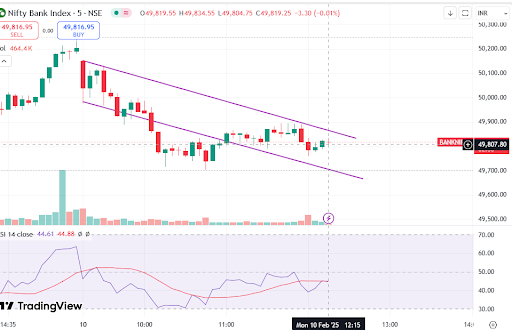
- The chart is of Nifty Bank Index (Bank NIFTY) on a 5-minute timeframe.
- Descending Channel Formation: The price is currently trading inside a falling wedge or descending channel, indicating a short-term downtrend.
- Support and Resistance:
- The lower trendline of the channel acts as support around 49,700-49,750.
- The upper trendline acts as resistance around 49,850-49,900.
- RSI Indicator:
- RSI is currently around 44.31, which indicates mild weakness but also potential for a reversal if it crosses 50+.
- If RSI drops below 40, further selling pressure may be expected.
Intraday Target (TGT) & Stop Loss (SL)
Bullish Scenario (If Price Breaks Above the Channel)
- Entry: Above 49,850
- Target (TGT): 50,000-50,100
- Stop Loss (SL): 49,700
Bearish Scenario (If Price Continues Downtrend)
- Entry: Below 49,750
- Target (TGT): 49,600-49,500
- Stop Loss (SL): 49,900
Short-Term View (1-2 Weeks)
- Key Levels to Watch:
- If Bank NIFTY breaks above 50,000, we could see a move towards 50,500-50,800.
- If the index fails to hold 49,500, further downside towards 49,200-49,000 is possible.
- Indicators Suggest:
- A breakout above the descending channel could lead to a reversal.
- A breakdown below 49,700 would confirm continued weakness.
Long-Term View (1-3 Months)
- Strong Resistance: 50,500-50,800 zone.
- Strong Support: 49,000-48,500.
- Trend Outlook:
- As long as Bank NIFTY stays above 49,500, it remains in a consolidation phase.
- A breakout above 50,500 would confirm a bullish rally.
- A breakdown below 48,500 could trigger a deeper correction.
Conclusion
- Intraday View: Bullish breakout above 49,850; bearish below 49,750.
- Short-Term View: Watching 49,500 support & 50,000 resistance.
- Long-Term View: Needs a breakout above 50,500 for a strong rally


No comments:
Post a Comment