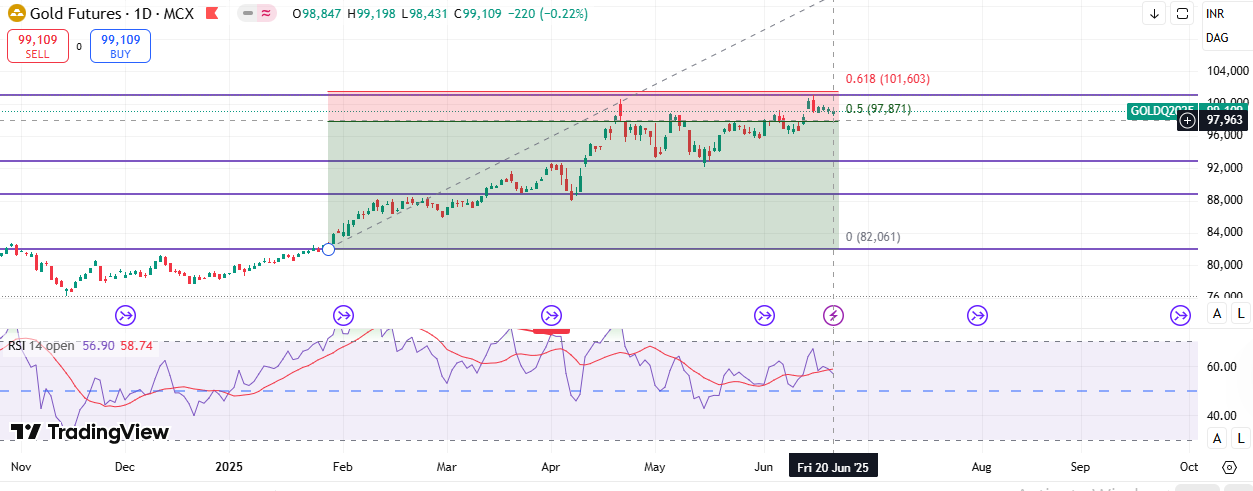
Analysis of VIX Chart with Targets and Stop-Loss Strategy
The chart provided is of the Volatility Index (VIX) on a daily timeframe, featuring key technical levels such as Fibonacci retracements, trendlines, and support/resistance zones. Below is a breakdown of potential target (TGT) and stop-loss (SL) levels based on different trading perspectives:
1. Intraday View (Short-Term Trading)
Entry Consideration: Given the recent breakout attempt from a downtrend and the sharp move to 16.54 (+6.71%), an intraday trader may look for opportunities near key levels.
Target (TGT):
First resistance: 17.31 (Fib 0.618)
Second resistance: 20.40 (Fib 0.5)
Stop-Loss (SL):
Below 15.00, as a breakdown under this level could invalidate the short-term bullish move.
2. Short-Term View (Swing Trading)
Entry Consideration: If the VIX sustains above 16.00 and forms a higher low, traders may target a reversal towards stronger resistance.
Target (TGT):
Primary: 20.40 (Fib 0.5 level)
Extended: 23.48 (Fib 0.382 resistance zone)
Stop-Loss (SL):
Below 14.50, as a close below this would indicate a potential return to lower volatility levels.
3. Long-Term View (Investment/Positional)
Entry Consideration: The 12.92 level (Fib 0.786) acts as a strong support zone, making it a key area for long-term VIX traders looking for a potential spike in volatility.
Target (TGT):
First Major Target: 23.48 (long-term resistance)
Extended Targets: 28.00+ (historical volatility spikes zone)
Stop-Loss (SL):
Below 12.50, indicating further decline in volatility.
Key Observations & Market View
Downtrend Line: The chart shows a descending trendline, which needs a confirmed breakout for sustained upside.
Fibonacci Levels: The 0.618 and 0.5 retracements will be key areas to watch for resistance.
RSI Indicator: RSI is near 50, suggesting a neutral momentum. A move above 60 could signal strong bullishness.
Conclusion:
Intraday traders should focus on 16.50–17.30 resistance levels with a stop below 15.00.
Short-term traders can aim for 20.40–23.50, setting a stop around 14.50.
Long-term investors might consider buying near 12.92, aiming for 23.50–28.00, with a stop below 12.50.


No comments:
Post a Comment