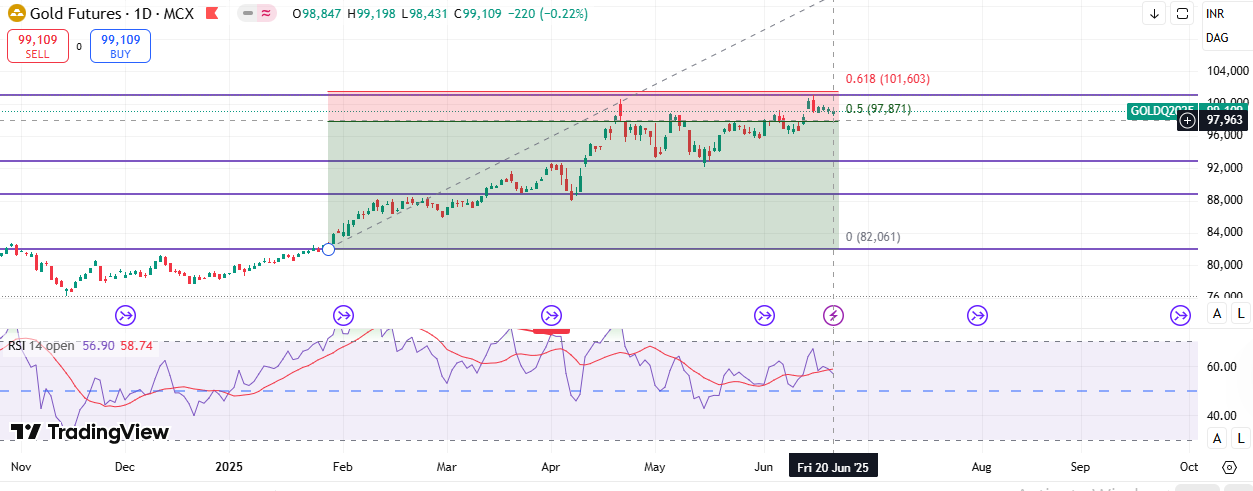
USD/INR Analysis Based on the Chart
Overall View:
The pair is in a strong uptrend, with price action moving upwards.
Fibonacci retracement levels are drawn, indicating potential support and resistance zones.
RSI (Relative Strength Index) is above 70, meaning the pair is in overbought territory, signaling a potential correction or consolidation.
Key resistance is around 87.97 (Fibonacci 0.786 level), which is acting as a strong barrier.
Immediate support levels are 87.11 (Fibonacci 0.618), 86.55 (Fibonacci 0.5), and 85.96 (Fibonacci 0.382).
Short-Term View (1-2 Weeks)
Target (TGT): 87.90 - 88.00
Stop Loss (SL): 86.55
Trade Outlook: Bullish, but a correction might occur before another upward move.
Strategy: If price sustains above 87.50, a move towards 87.90 - 88.00 is expected.
Medium-Term View (1-2 Months)
Target (TGT): 88.50 - 89.00
Stop Loss (SL): 85.95
Trade Outlook: If the pair consolidates above 87.00 and breaks 87.90, the next major target is 88.50 - 89.00.
Strategy: Wait for confirmation above 87.90 for further bullish momentum.
Long-Term View (3-6 Months)
Target (TGT): 90.00+
Stop Loss (SL): 85.50
Trade Outlook: The trend remains strong, and if global USD strength continues, INR may weaken further, leading USD/INR towards 90.00+ levels.
Strategy: Hold long positions as long as 85.50 remains intact.
Final Conclusion
The trend is bullish across all timeframes.
RSI Overbought Condition: A short-term pullback might occur.
Key Resistance: 87.90 - 88.00. A breakout could lead to further upside.
Support Levels: 87.10 - 86.55 - 85.95.
Traders should trail stop-losses and book partial profits at key resistance levels.


No comments:
Post a Comment