Based on the chart provided for Nifty 50 Index (1-minute time frame), here is a detailed technical analysis and insights for short-term and long-term investment decisions:
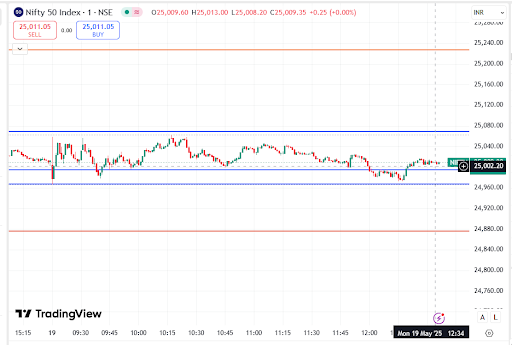
📉 Current Status: Price: Around ₹25,012
Time: Intraday chart (1-minute)
Observed Range:
Support: ~24,960 (blue horizontal support)
Resistance: ~25,080 (blue horizontal resistance)
Price is consolidating in a tight range of ~120 points.
🔍 Short-Term Analysis (Intraday to a Few Days): 📌 Trade Setup: Buy if price sustains above 25,080 with strong volume.
Sell/Short if price breaks down below 24,960 with confirmation.
✅ Bullish Scenario (Breakout): Entry: Above 25,080
Target: 25,160 – 25,200 (previous swing highs, next resistance)
Stop Loss: 24,980
Potential Gain: ~0.6% – 0.8%
Risk: ~0.4%
Risk:Reward: ~1.5–2:1
❌ Bearish Scenario (Breakdown): Entry: Below 24,960
Target: 24,880 – 24,840 (orange support level visible on the chart)
Stop Loss: 25,040
Potential Gain: ~0.5% – 0.7%
Risk: ~0.3%
Risk:Reward: ~2:1
🕰️ Medium-Term to Long-Term View: 🔧 Technical Outlook (Daily/Weekly): While the current chart is a 1-minute intraday chart, here's what we consider for broader outlook:
📈 For Medium-Term Holding (1–4 weeks): Buy above: 25,200 with volume confirmation
Target: 25,500 – 25,800
Stop Loss: 24,880
Potential Upside: ~2% – 3%
Risk: ~1%
📊 For Long-Term Holding (1–6 months+): Buy Zone: Accumulate on dips between 24,600 – 24,900
Target: 26,000 – 26,500 (assuming election rally and positive sentiment)
Stop Loss: Close below 24,400
Potential Upside: ~5% – 6%
Risk: ~2.5%
📌 Important Observations: Sideways Range in the short term suggests indecision; breakout or breakdown will give direction.
Volume confirmation is key—watch for spikes during breakout levels.
Macro factors like interest rates, inflation, global cues, and elections will impact medium/long term.
📊 Overall Potential: Term Potential Upside Stop Loss Level Reward:Risk Estimate Intraday 0.6% – 0.8% 0.4% 1.5 – 2:1 Short-Term 2% – 3% 1% 2 – 3:1 Long-Term 5% – 6% 2.5% 2:1
🧠 Key Takeaways: Wait for breakout (above 25,080) or breakdown (below 24,960) before taking action.
Use tight stop losses to manage risk.
Long-term looks positive if index holds above 24,400 in the coming weeks.


No comments:
Post a Comment