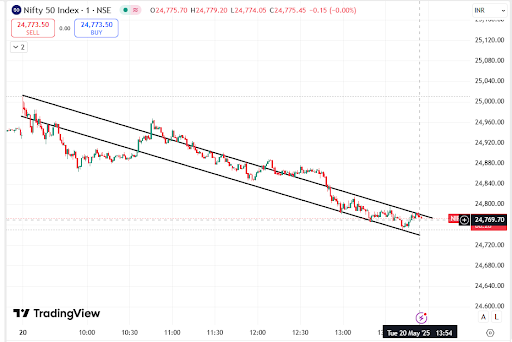
Based on the provided 1-minute chart of NIFTY 50 (as of May 20, 2025, 13:47 IST) and your comment that it's currently trading around 24,890, here's a technical breakdown and recommendation:
📉 Technical Analysis:
- Trend Analysis: The chart shows a clear downward channel, indicating a short-term bearish trend.
Price is moving within a well-defined descending channel, and at the current moment (in the image), it is testing the upper boundary of the channel, suggesting a potential resistance.
- Support & Resistance: Immediate Resistance (Channel Upper Line): ~24,800-24,820
Immediate Support (Channel Lower Line): ~24,700
Breakout Resistance: ~24,850–24,900
Major Support Zone: ~24,600
📊 Trading Strategy (Short-Term – Intraday/Swing): If it breaks out upward (above 24,820–24,850): Action: Go Long (Buy)
Target:
Short-Term: 24,950
Extended: 25,050
Stop Loss: 24,720 (below breakout base)
Potential Gain: ~160 points
Risk: ~130 points
Risk-Reward Ratio: ~1.2:1
If it gets rejected at the top and falls back into the channel: Action: Go Short (Sell)
Target:
Near-Term: 24,700
Extended: 24,600
Stop Loss: 24,850
Risk-Reward Ratio: ~1.5:1
📈 Investment View (Short-Term to Long-Term): Short-Term (Few Days to Weeks): Wait for a breakout confirmation above 24,900–25,000.
If breakout sustains:
Target: 25,200 – 25,500
Stop Loss: 24,700
Upside Potential: ~2.5% from breakout
Risk: ~1.2%
Long-Term (Few Months+): A breakout above 25,000 on strong volume may lead to:
Target 1: 25,800
Target 2: 26,500
Stop Loss: Close below 24,400
Upside Potential: ~6.5–10%
Risk: ~2%
📌 Conclusion & Recommendation: Term Action Entry Level Target Range Stop Loss Potential Intraday Buy on breakout above 24,850 24,850–24,870 24,950–25,050 24,720 ~0.6–0.8% Swing Buy above 24,900 24,900–25,000 25,200–25,500 24,700 ~2.5% Long-Term Accumulate on dips above 24,600 24,600+ 25,800–26,500 24,400 ~6–10%
⚠️ Important Notes: The NIFTY is an index, not a stock — you invest via ETFs, futures, or options.
Keep an eye on global cues, FII activity, and economic data which can heavily influence NIFTY.
Use a trailing stop loss once it begins moving in your favor.


No comments:
Post a Comment