
Technical view with target and stop loss explanation for Bank Nifty, based on the chart and analysis provided in the image:
🔍 Technical Overview: Bank Nifty closed at 55,677, above its 10-day EMA, which suggests short-term strength.
RSI has not yet confirmed a bullish crossover, indicating limited momentum.
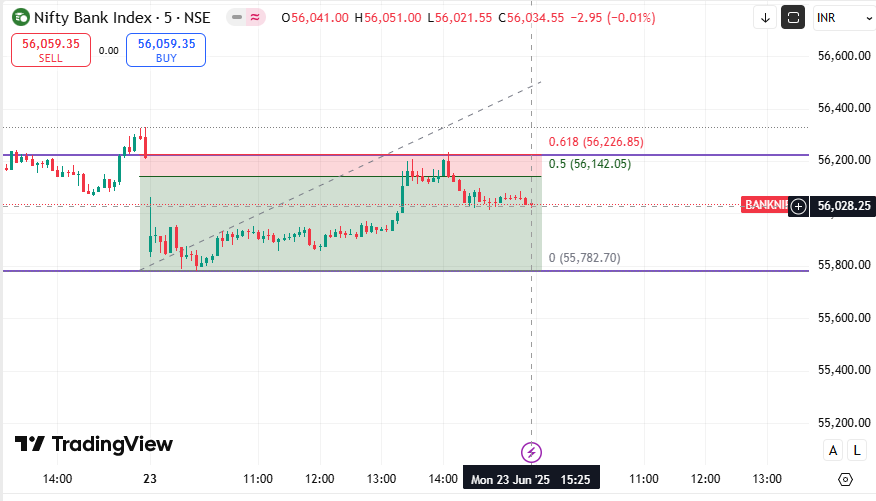
The index is stuck in a consolidation zone between 55,200 (support) and 56,000 (resistance).
Breakout level: A clear directional move will come only if Bank Nifty closes above 56,200.
🎯 Target and Stop Loss Setup: ✅ If Bullish Breakout Happens (Above 56,200): Buy only on a daily closing above 56,200.
Target: 56,500 – 56,800+
Stop Loss: 55,900 (to limit risk below breakout level)
Rationale: A breakout above resistance with confirmation can lead to momentum-driven upside.
⚠️ If No Breakout – Range-Bound Trading: The index is consolidating between 55,200 – 56,000, so traders can:
Buy near 55,200 (Support) with Target: 55,800 – 56,000
Stop Loss: 55,000
Or Sell near 56,000 (Resistance) with Target: 55,300 – 55,200
Stop Loss: 56,200
📊 Support & Resistance Levels (from pivot table): Support (S1/S2): 55,460 / 55,243
Resistance (R1/R2): 55,842 / 56,008
Pivot Point (PP): 55,625
⏱️ Summary for Trade Setup: Scenario Action Entry Target Stop Loss Breakout Above 56,200 Buy > 56,200 56,500 – 56,800 55,900 Range Trade (Support) Buy ~ 55,200 55,800 – 56,000 55,000 Range Trade (Resistance) Sell ~ 56,000 55,300 – 55,200 56,200
⚙️ Technical Indicators: EMA: Price is above 10-day EMA – short-term strength.
RSI: Yet to confirm bullish crossover – momentum is still cautious.


No comments:
Post a Comment