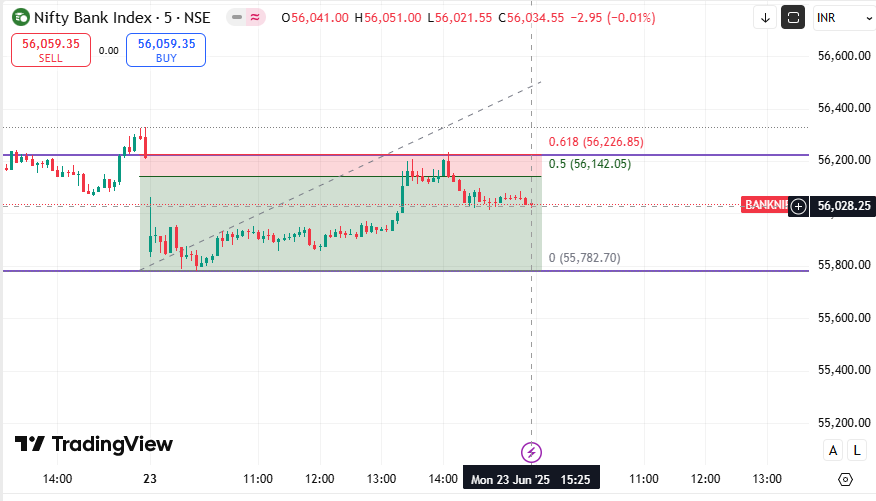
Nifty Bank Index 5-minute chart you provided (dated June 23, 2025), here is a detailed technical analysis with Target, Stop Loss, Support & Resistance levels, and Fibonacci levels:
🔍 Technical Overview: Current Price: ₹56,034.55
Day High/Low: ₹56,051 / ₹56,021
Fibonacci Levels (from swing low ₹55,782.70 to swing high ~₹56,400):
0.0% (Support): ₹55,782.70
0.5 (Key Level): ₹56,142.05
0.618 (Resistance): ₹56,226.85
📊 Support & Resistance Levels (Today) Level Price (₹) Comment Resistance 1 56,142 (Fib 0.5) Important intraday resistance Resistance 2 56,227 (Fib 0.618) Strong resistance (if breakout) Support 1 55,900 (Price floor zone) Intraday support zone Support 2 55,782 (Fib 0%) Strong support (swing low)
🎯 Trading Plan (Intraday) 📈 Bullish Scenario (If Breaks 56,142 Level): Buy Above: ₹56,150
Target 1: ₹56,225 (Fib 0.618)
Target 2: ₹56,300 (next fib extension zone)
Stop Loss: ₹56,000 (below today's consolidation zone)
📉 Bearish Scenario (If Breaks 55,900 Support): Sell Below: ₹55,900
Target 1: ₹55,782 (Fib base support)
Target 2: ₹55,700
Stop Loss: ₹56,050 (above today's average range)
📌 Chart Insights: The index is range-bound between 55,900–56,140.
There is low momentum, indicating a breakout or breakdown is likely in the next session.
Fibonacci retracement suggests a retest of 0.618 (₹56,226) if buying picks up.
Volume confirmation is important before breakout trades.
If you're trading short-term (intraday), stay cautious around the 56,140–56,230 zone as it's a supply area (resistance). For swing trading, wait for a clear breakout above 56,250 or breakdown below 55,780.


No comments:
Post a Comment