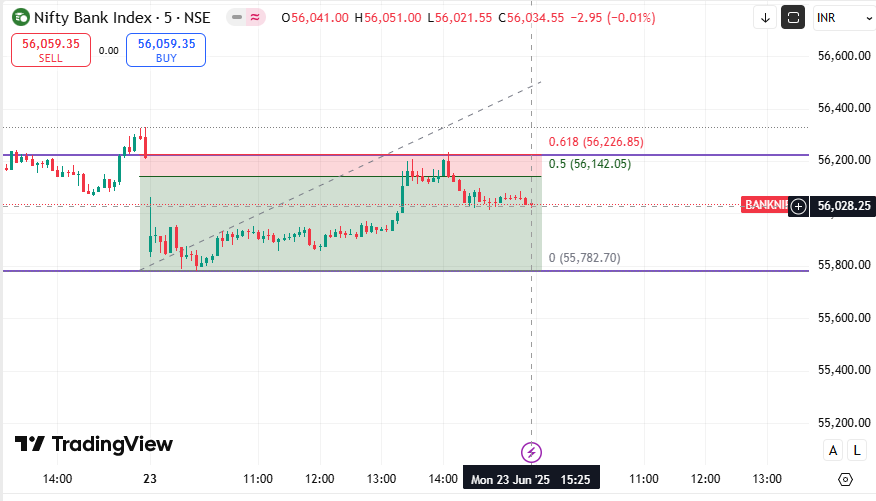
BANKNIFTY Technical View with Target & Stop Loss
🧠 Chart Analysis Summary (From Image)
-
Trend: Bank Nifty has formed a bearish candlestick on the daily chart.
-
Indicators:
-
10-day EMA: Price closed near the 10-EMA, indicating a possible trend shift.
-
RSI: Nearing bearish crossover, showing weakening momentum.
-
-
Chart Pattern: Price appears to be forming a double top/resistance zone around 56,200.
🎯 Target & Stop Loss Setup
✅ Short-Term Trade Setup (Bearish Bias)
| Type | Level | Explanation |
|---|---|---|
| Entry | 55,900–56,000 | Near current price / resistance zone |
| Target 1 | 55,200 | Immediate support level as per LKP view |
| Target 2 | 55,000 | Below S1 and towards stronger support |
| Stop Loss | 56,250 | Above resistance (R1) & recent highs |
📉 Potential Downside:
Target 1 offers ~700–800 pts downside
Risk-Reward Ratio: ~1:2 if entry is near 56,000 with 250 pts stop.
✅ Support & Resistance Levels
| Type | Levels |
|---|---|
| Support | 55,317 (S1), 55,033 (S2) |
| Resistance | 56,022 (R1), 56,445 (R2) |
If Bank Nifty breaks below 55,200, then next targets can be S1 and S2 levels.
📌 Trade View
-
Bias: Cautious bearish till RSI confirms a bounce.
-
Conditions to Reverse View: If price sustains above 56,200–56,250 with strong volume and RSI bounce, then bullish breakout possible.
-
Timeframe: 1–3 days (Intraday to Short-term)


No comments:
Post a Comment