Nifty 50 intraday chart (5-minute timeframe) based on the image you shared for Monday, 23rd June 2025:
🔍 Chart Overview
-
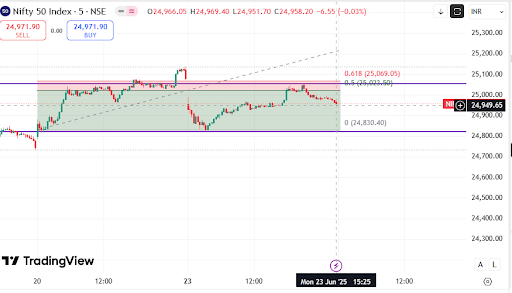
Instrument: Nifty 50 Index (NSE)
-
Timeframe: 5-Minute
-
Date: 23rd June 2025
-
Price Range: 24,830 – 25,100 approx.
📈 Technical Levels
✅ Support Levels
-
Support 1:
24,830(marked as Fibonacci 0 level & bottom of the green zone) -
Support 2:
24,900(recent horizontal consolidation zone and minor bounce area)
❌ Resistance Levels
-
Resistance 1:
25,023(Fibonacci 0.5 retracement level) -
Resistance 2:
25,069(Fibonacci 0.618 retracement zone – strong resistance) -
Resistance 3:
25,120–25,150(price rejection zone from earlier candles)
📊 Fibonacci Analysis
-
Fibonacci drawn from low (24,830) to high (~25,150).
-
Price retraced back below 0.5 and 0.618 levels after rejection.
-
Indicates short-term weakness below the 0.618 level (
25,069).
📉 Trend & Momentum View
-
Short-Term: Bearish Bias (as price failed to sustain above 0.618 retracement).
-
Price broke down from the rising channel and is testing horizontal support near
24,950–24,900. -
Candle patterns show selling pressure after hitting the resistance zone.
🎯 Trade Setup Suggestion
🔻 If Shorting (Bearish View):
-
Entry: Near
24,980–25,000on pullback. -
Target 1:
24,900 -
Target 2:
24,830 -
Stop Loss:
25,070(above 0.618 retracement & resistance zone)
🔼 If Buying (Bullish View from Support):
-
Entry: Around
24,900–24,920(if support holds) -
Target 1:
25,000 -
Target 2:
25,030–25,070 -
Stop Loss:
24,880(below strong support)
🕒 Intraday Summary (23 June 2025)
-
High: ~25,150 (morning)
-
Low: ~24,830 (previous session)
-
Current: ~24,950
-
After testing highs, Nifty faced resistance and started to decline, staying below key Fib levels — suggesting profit-booking or short-term correction.
📌 Key Notes
-
Watch for break below 24,900 for downside momentum.
-
Strong bounce only expected if price reclaims 25,070+ on volume.
-
Intraday range: Likely to stay between 24,830 – 25,070 unless a breakout occurs.


No comments:
Post a Comment