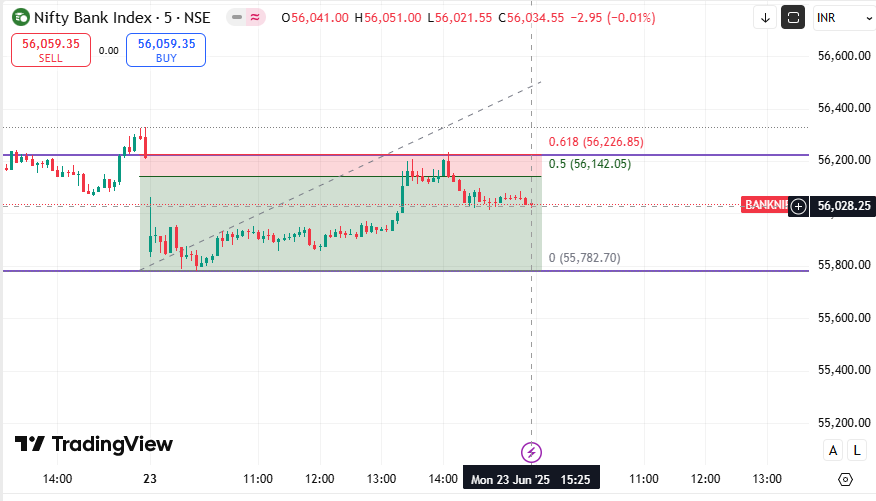
BANKNIFTY – Technical View, Target & Stop Loss Analysis
🔍 Technical Analysis Summary (From Image)
-
Breakout Confirmed: Bank Nifty decisively broke the key resistance of 56,200, closing with a bullish candlestick.
-
Momentum Indicator (RSI): Entered bullish crossover, indicating strong upward momentum.
-
Trend Setup: Strong bullish trend with price sustaining above short-term moving averages.
-
Volume: Good volume confirmation supports the breakout rally.
🎯 Target & Stop Loss (Based on Technical Setup)
✅ Short-Term View (1–5 Days)
-
Buy Zone: On dips near 56,200–56,300 (previous resistance now support)
-
Target:
-
🎯 T1: 57,000 (near-term resistance / R1 level)
-
🎯 T2: 57,430 (R2 pivot level and breakout projection zone)
-
-
Stop Loss: 🔻 55,840 (S1 support, below breakout level)
📆 Medium-Term View (1–4 Weeks)
-
Trend: Higher highs and bullish momentum with RSI support
-
Target:
-
🎯 T1: 57,430 (R2 and psychological resistance)
-
🎯 T2: 58,200–58,500 (next fib extension / wave projection)
-
-
Stop Loss: 🔻 55,100 (S2 Pivot Support / medium support zone)
📈 Long-Term View (1–3 Months)
-
Outlook: Positive with potential to retest 2021–2022 highs if momentum sustains
-
Target:
-
🎯 T1: 59,000
-
🎯 T2: 60,500+ (multi-month breakout target)
-
-
Stop Loss: 🔻 55,000 (major swing support)
🔄 Summary Table
| Timeframe | Entry Zone | Target | Stop Loss |
|---|---|---|---|
| Short Term | 56,200–56,300 | 57,000 / 57,430 | 55,840 |
| Medium Term | 56,300–56,600 | 57,430 / 58,500 | 55,100 |
| Long Term | On dips to 56,000 | 59,000 / 60,500 | 55,000 |
🔁 Strategy Suggestion
-
📌 Buy-on-Dip approach is ideal while RSI is bullish and trend remains strong.
-
📉 Exit or Tighten SL if RSI shows divergence or price falls below 55,800.


No comments:
Post a Comment