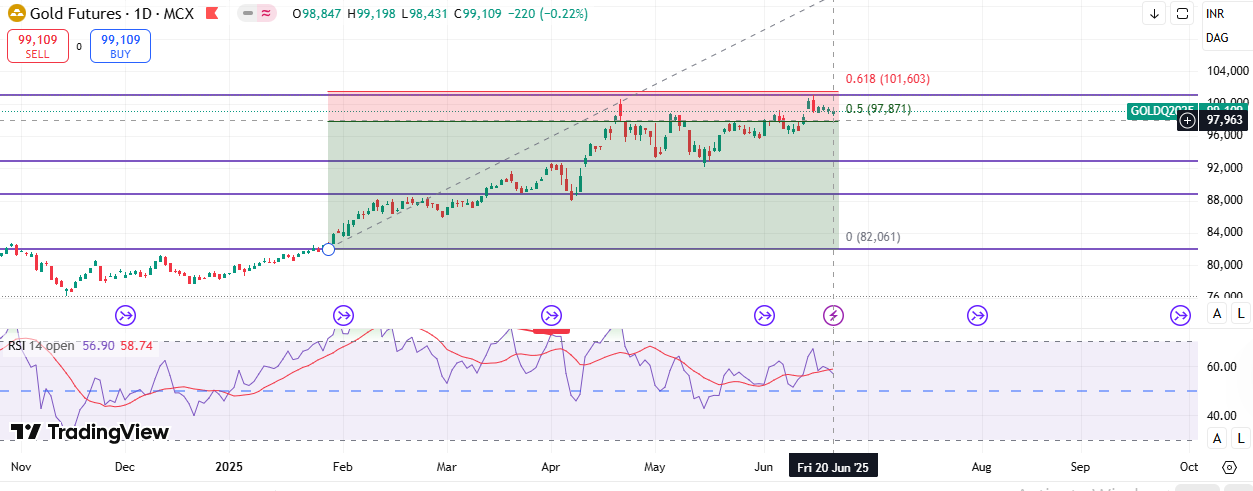
Canara Bank (NSE: CANBK) that you provided (Daily timeframe), here’s a detailed technical analysis with targets, stop loss, support/resistance levels, and short, medium, and long-term outlooks:
🔍 Technical Chart Analysis Summary Chart Pattern:
A classic A-B-C retracement visible.
The price is reacting after a significant impulse uptrend, followed by a retracement from the recent high around ₹125.
Recent bearish engulfing candle near ₹120-125 zone, indicating supply pressure.
📊 Key Levels 🔻 Support Zones: ₹106–108 – Immediate support (currently testing this zone)
₹98–100 – Strong support (consolidation zone and breakout level)
₹85–88 – Major support (bottom of the pattern)
🔺 Resistance Zones: ₹118–120 – Immediate resistance (recent swing high and selling pressure zone)
₹125–127 – Major resistance (supply zone from earlier peak)
₹135+ – Long-term resistance
🎯 Target & Stop Loss Recommendations 📍 For Long Position (Bullish Trade): Entry: Around ₹107–108 (current level or pullback to ₹106 zone)
Target 1: ₹118 (approx. 9–10% upside)
Target 2: ₹125 (approx. 15–16% upside)
Stop Loss: ₹99 (below strong support zone)
Risk-Reward: Approx 1:2.5+
📍 For Short Position (If bearish bias continues): Entry: Near ₹118–120 resistance zone (if price retests and rejects)
Target 1: ₹106
Target 2: ₹98
Stop Loss: ₹122
Risk-Reward: Approx 1:2
📆 Timeframe Outlook 🔹 Short-Term View (1–4 weeks): Neutral to Bullish Bias
As long as price holds above ₹106 and especially ₹100, upside remains probable.
Possible consolidation in ₹106–118 range.
🔸 Medium-Term View (1–3 months): Bullish Bias
If ₹120 breakout sustains, potential move towards ₹130–135.
Strong fundamental + technical recovery from earlier downtrend.
🔺 Long-Term View (3+ months): Bullish Structure Intact
Higher highs and higher lows forming.
If broader market remains supportive and ₹135 is taken out, a longer uptrend can emerge with targets in ₹150+ zone.
📉 Risk Factors: Heavy rejection from ₹120+ level recently.
If ₹98 support breaks, medium-term structure could weaken.
Monitor volume around key levels – selling volume on down candles could indicate further downside.
📌 Conclusion: View Direction Entry Targets Stop Loss Potential (%) Short-Term Bullish ₹106–108 ₹118 / ₹125 ₹99 +9% to +15% Medium-Term Bullish ₹108–110 ₹125 / ₹135 ₹98 +16% to +25% Long-Term Bullish ₹108 ₹135 / ₹150 ₹85 +25% to +38%


No comments:
Post a Comment