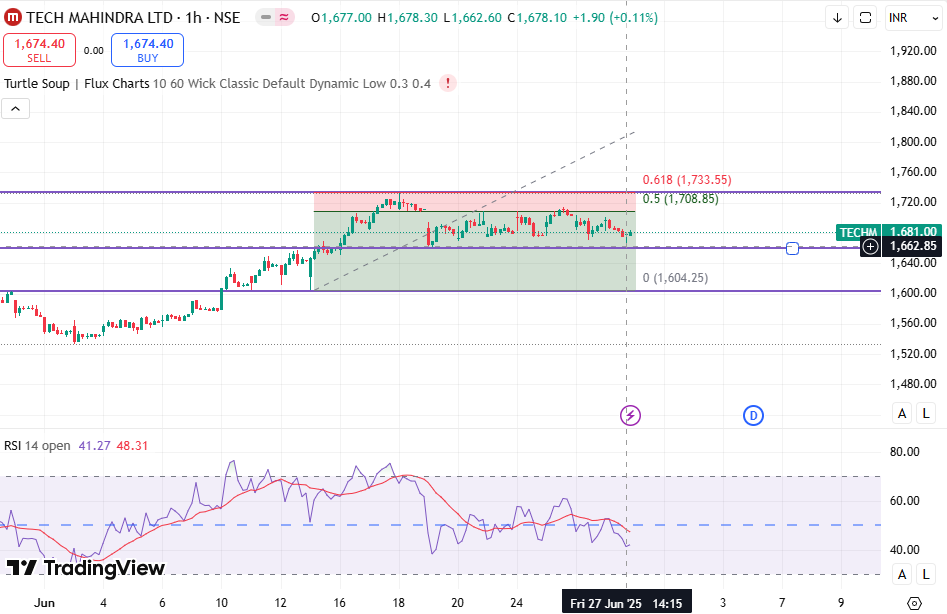
Tech Mahindra Ltd. (TECHM) based on the provided chart and current indicators:
🔍 Technical View (1-Hour Chart) ✅ Key Levels: Current Market Price (CMP): ₹1,678.10
Immediate Resistance:
₹1,708 (50% Fibonacci level)
₹1,733 (61.8% Fibonacci retracement – strong resistance zone)
Immediate Support:
₹1,662 (recent lower bound of the range)
₹1,604 (Fibonacci 0 level & major support)
📈 Range and Pattern Observation: Sideways consolidation: Price is range-bound between ₹1,662 to ₹1,708 for several sessions, indicating indecision.
Breakout Watch:
A breakout above ₹1,708 could lead to a move toward ₹1,733 and higher.
Breakdown below ₹1,662 may drag the stock toward ₹1,604.
📊 RSI Indicator (Relative Strength Index): Current RSI: 41.27 – mildly bearish.
RSI is below 50 and trending downward, showing weak momentum.
No bullish divergence spotted, indicating downside risk remains.
🎯 Trade Setup: 📌 Bullish Scenario (Breakout above ₹1,708): Buy Above: ₹1,710
Target 1: ₹1,733
Target 2: ₹1,760
Stop Loss: ₹1,662
Risk-Reward: Good (1:2 or better)
📌 Bearish Scenario (Breakdown below ₹1,662): Sell Below: ₹1,660
Target 1: ₹1,625
Target 2: ₹1,605
Stop Loss: ₹1,685
🧠 Fundamental View (as of FY24): Factor Status Revenue Growth Moderate (IT sector slowdown) Profit Margins Under pressure (global demand) Digital Transformation Company is investing steadily Valuation Reasonable vs. TCS/Infosys peers Dividend Yield Decent (around 2%) Q4 Results Slight miss on revenue expectations Management Commentary Cautious optimism for FY25
Sector Outlook: Mixed. Global IT demand is showing signs of revival, but TechM’s revenue is still under pressure compared to its larger peers like Infosys and TCS.
📆 Summary: Short/Medium/Long-Term View Time Frame Bias Target(s) View Summary Short Term Neutral ₹1,708 / ₹1,625 Wait for breakout or breakdown Medium Term Cautiously Bullish ₹1,760 / ₹1,800 On breakout above ₹1,733 Long Term Positive ₹1,950+ Based on digital transformation gains


No comments:
Post a Comment