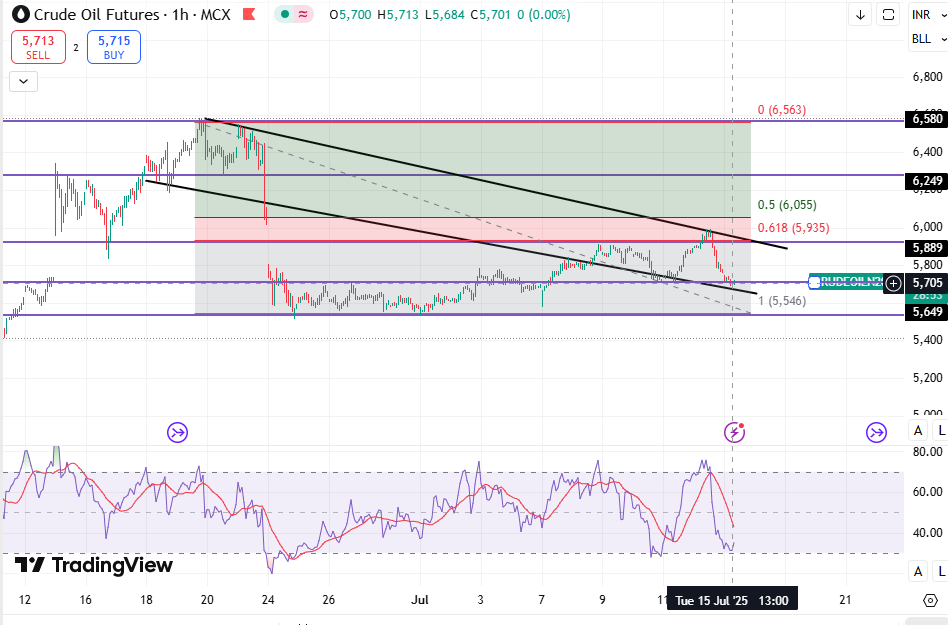
Crude Oil Futures (MCX 1H chart) with trend, support, resistance, pivot levels, target & stop-loss strategy:
🔹 Current Trend Price has been in a falling wedge pattern, recently bouncing but failing near the 0.618 Fib retracement (₹5,935).
Currently trading around ₹5,705, near lower wedge support.
Short-term trend: Bearish to sideways (momentum weak).
Medium-term trend: Potential reversal if it holds above ₹5,650–₹5,700.
🔹 Key Levels ✅ Resistance Levels
₹5,935 → 0.618 Fib retracement & falling trendline resistance
₹6,055 → 0.5 Fib level
₹6,249 → Major resistance zone
₹6,580 → Previous swing high
✅ Support Levels
₹5,705 → Immediate support (current zone)
₹5,649–₹5,650 → Strong support (previous low)
₹5,546 → Next strong support
✅ Pivot Levels
Daily Pivot: Around ₹5,800
Below pivot → bearish bias
Above pivot → bullish recovery
🔹 Indicators RSI (Stochastic): Oversold region, slight recovery possible
Price Reaction: Testing wedge support, may see short-term bounce
🔹 Trade Plan 🔻 SELL on Rise (Preferred for short-term)
Sell near ₹5,880–₹5,930 (resistance zone)
Target: ₹5,705 → ₹5,650 → ₹5,546
Stop-Loss: Above ₹6,000
✅ BUY for Countertrend Bounce (Risky)
Buy near ₹5,650–₹5,700 support
Target: ₹5,880 → ₹5,935
Stop-Loss: Below ₹5,640
🔹 Which Side Makes Money? Intraday/Short-term: Selling on rallies is safer (trend still weak).
Medium-term: Wait for breakout above ₹5,935–₹6,000 for a bullish reversal toward ₹6,249–₹6,580.
🔹 Summary Trend bias: Bearish → Sell on rise
Key support: ₹5,650
Key resistance: ₹5,935
Safe trade:
Sell near ₹5,880–₹5,935 with SL ₹6,000 & Target ₹5,650
Or wait for breakout above ₹6,000 for buying opportunity


No comments:
Post a Comment