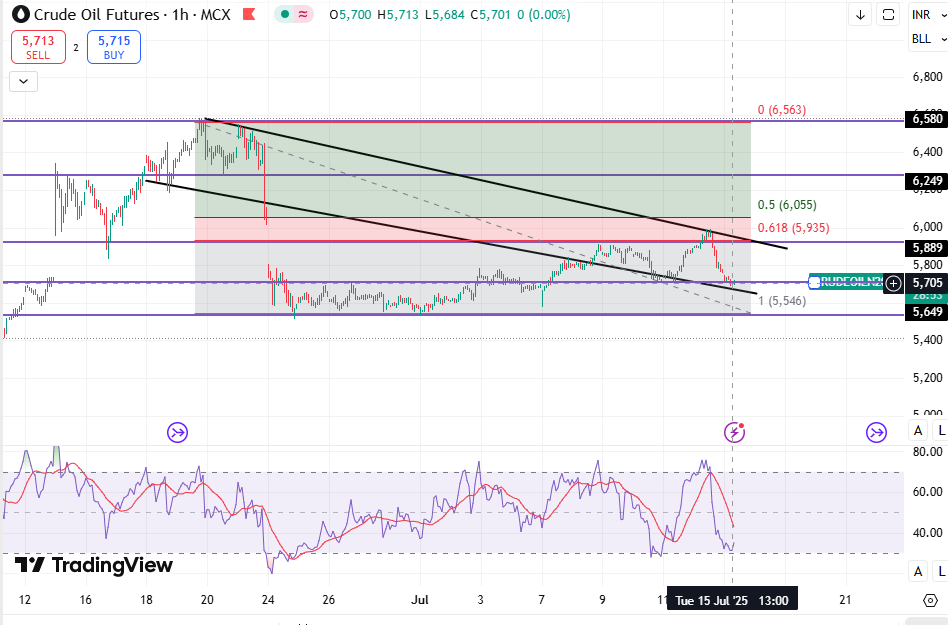
Natural Gas Mini Futures (1h chart, MCX) with trend, support/resistance, pivot levels, targets & stop loss for short to medium term:
🔍 Trend Analysis Downtrend channel visible (black lines) → price still inside bearish channel.
Recent bounce from 272.1–280 support zone, indicating buyers stepping in.
Now facing resistance near 296–300, aligning with the upper channel trendline.
Momentum indicator (Stochastic RSI) is coming down from overbought levels, suggesting near-term pullback risk.
✅ Key Levels Immediate Resistance:
296–300 (upper trendline resistance)
309–310 (Fib 0.618 level)
321.5 (Fib 0.5 retracement)
345 major resistance
Immediate Support:
280–282 (horizontal support)
272.1 (swing low & major support)
Pivot Point (short-term): ~294.0
Above pivot = bullish intraday bias
Below pivot = bearish continuation
🎯 Trade Ideas 🔼 Bullish Scenario (If price sustains above 296) Buy Entry: above 296–300 breakout
Target 1: 309–310
Target 2: 321.5
Medium-term Target: 345
Stop Loss: below 288
Reason: Breakout from descending channel + Fibonacci retracement upside potential.
🔽 Bearish Scenario (If price rejects 296 & breaks 280) Sell Entry: below 280
Target 1: 272.1
Target 2: 260 (extension of channel downside)
Stop Loss: above 296
Reason: Continuation of downtrend inside falling channel.
📊 How to Trade & Make Money Short-term traders:
Watch for breakout above 296 for a quick move to 309–310.
Or short if rejection occurs near 296, targeting 280.
Medium-term traders:
Trend still bearish, so better to sell rallies until channel breakout >300–310 happens.
If breakout confirmed, medium-term upside up to 321–345 possible.
Risk Management:
Always use tight stop loss since natural gas is volatile.
Avoid trading in the middle of the channel; wait for clear breakout or rejection levels.
📌 Summary Short-term bias: Neutral → slight bullish only if breaks 296.
Medium-term bias: Bearish unless sustained above 309–310.
Best strategy → Buy breakout above 296 for 309/321 targets OR Sell below 280 for 272/260 targets.
Would you like me to: ✅ Mark exact BUY/SELL zones with targets & SL on the chart for better clarity? Or ✅ Give a short-term vs medium-term trading plan (like 1–3 days vs 1–2 weeks)?


No comments:
Post a Comment