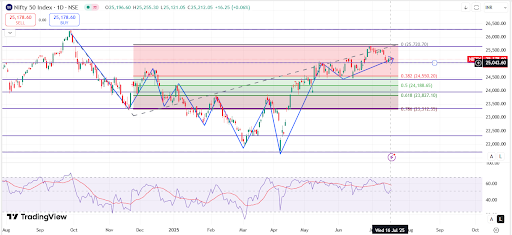
Nifty 50 daily chart with technical view, pivot levels, support-resistance, and target/stop-loss for short, medium, and long term.
🔹 Current Price CMP: 25,212
Last swing high: 25,720
RSI: near neutral zone (~50-55) → no clear overbought/oversold signal.
🔹 Key Fibonacci Levels 0.382 retracement: 24,550 (first support zone)
0.50 retracement: 24,188 (major support)
0.618 retracement: 23,827 (strong support)
0.786 retracement: 23,312 (deep support)
🔹 Support & Resistance ✅ Immediate Resistance:
25,250 – 25,300 (trendline & pivot resistance)
25,720 (recent swing high)
✅ Immediate Support:
25,000 – 24,950 (psychological level & trendline support)
24,550 (Fib 0.382)
24,200 (Fib 0.50)
🔹 Trend View Short-Term Trend: Slightly sideways to bullish unless it breaks below 25,000
Medium-Term Trend: Bullish as long as it holds 24,200
Long-Term Trend: Still uptrend, higher highs & higher lows intact
🔹 Pivot Levels Pivot Point: 25,150
Resistance 1 (R1): 25,350
Resistance 2 (R2): 25,550
Support 1 (S1): 25,000
Support 2 (S2): 24,750
🔹 Trading Plan ✅ Short-Term (1–2 weeks) If Nifty holds above 25,000, expect a bounce towards 25,350 → 25,550
Stop-Loss: 24,950
Target: 25,350 / 25,550 / 25,720
If it breaks 25,000, it may test 24,550.
✅ Medium-Term (1–3 months) Strong support at 24,200–24,550
If this zone holds, next upside target 26,000+
Stop-Loss: 24,200
Target: 25,720 → 26,200 → 26,500
✅ Long-Term (3–6 months) Uptrend remains intact unless 23,800 breaks.
If market sustains above 25,000, the long-term target could be 27,000
Stop-Loss: 23,800
Target: 26,500 → 27,200
🔹 RSI & Momentum RSI is neutral (~50), indicating consolidation.
No clear overbought/oversold signal → market likely to move sideways near resistance.
✅ Summary Bullish bias above 25,000
Buy on dips near 25,000–24,550 for upside targets
If breaks below 24,550 → expect 24,200–23,800 zone


No comments:
Post a Comment