Friday, June 27, 2025

INDUSIND BANK FUTURES STOCK OF THE VIEW


INDUSIND BANK FUTURES (1-Minute Chart) 🕰 Chart Time: Fri, 27 June 2025 at 14:35 📊 Technical Overview: Current Price: ₹865.30

Day's High: ₹886.90

Day's Low: ₹865.30

Fibonacci Levels:

0.618 Retracement: ₹861.75 (Strong Support)

0.5 Retracement: ₹866.55 (Current Price Zone)

🔍 Short-Term View (Intraday to 2 Days): 📌 Support Levels: ₹861.75 (0.618 Fib): Strong intraday support

₹857–₹860: Psychological round-level support

📌 Resistance Levels: ₹866.55: Minor intraday resistance (0.5 Fib)

₹886.90: Strong resistance (Day High & Fib 0)

🎯 Short-Term Strategy: Buy Zone: ₹861–₹864 (near 0.618 retracement)

Target 1: ₹870

Target 2: ₹880

Stop Loss: ₹858 (below 0.618 Fib)

📈 If price sustains above ₹866.55, a breakout rally toward ₹880–₹886.90 can happen.

📈 Medium-Term View (2 Days to 2 Weeks): 🟢 Bullish if: Price closes above ₹870–₹872 on hourly chart

Volumes increase during upward moves

🎯 Medium-Term Targets: Target 1: ₹885

Target 2: ₹895

Stop Loss: ₹857 (below structure & retracement zone)

💡 Consolidation between ₹860–₹870 can indicate accumulation.

🏦 Long-Term View (2 Weeks to 2 Months): 🟠 Trend Bias: Neutral to mildly bullish If price breaks ₹886.90 on a daily close, it may trigger a long-term uptrend continuation.

🎯 Long-Term Targets: Target 1: ₹910

Target 2: ₹940+

Stop Loss: ₹848 (major support on daily)

🔧 Summary Table: Term Support Resistance Target(s) Stop Loss Short Term 861 / 858 866.55 / 886.90 870 / 880 858 Medium Term 857 / 860 885 / 895 885 / 895 857 Long Term 848 / 857 910 / 940 910 / 940+ 848

Tuesday, June 24, 2025

BANKNIFTY OVERVIEW


Nifty Bank Index 5-minute chart you provided (dated June 23, 2025), here is a detailed technical analysis with Target, Stop Loss, Support & Resistance levels, and Fibonacci levels:

🔍 Technical Overview: Current Price: ₹56,034.55

Day High/Low: ₹56,051 / ₹56,021

Fibonacci Levels (from swing low ₹55,782.70 to swing high ~₹56,400):

0.0% (Support): ₹55,782.70

0.5 (Key Level): ₹56,142.05

0.618 (Resistance): ₹56,226.85

📊 Support & Resistance Levels (Today) Level Price (₹) Comment Resistance 1 56,142 (Fib 0.5) Important intraday resistance Resistance 2 56,227 (Fib 0.618) Strong resistance (if breakout) Support 1 55,900 (Price floor zone) Intraday support zone Support 2 55,782 (Fib 0%) Strong support (swing low)

🎯 Trading Plan (Intraday) 📈 Bullish Scenario (If Breaks 56,142 Level): Buy Above: ₹56,150

Target 1: ₹56,225 (Fib 0.618)

Target 2: ₹56,300 (next fib extension zone)

Stop Loss: ₹56,000 (below today's consolidation zone)

📉 Bearish Scenario (If Breaks 55,900 Support): Sell Below: ₹55,900

Target 1: ₹55,782 (Fib base support)

Target 2: ₹55,700

Stop Loss: ₹56,050 (above today's average range)

📌 Chart Insights: The index is range-bound between 55,900–56,140.

There is low momentum, indicating a breakout or breakdown is likely in the next session.

Fibonacci retracement suggests a retest of 0.618 (₹56,226) if buying picks up.

Volume confirmation is important before breakout trades.

If you're trading short-term (intraday), stay cautious around the 56,140–56,230 zone as it's a supply area (resistance). For swing trading, wait for a clear breakout above 56,250 or breakdown below 55,780.

NIFTY 50 OVERVIEW


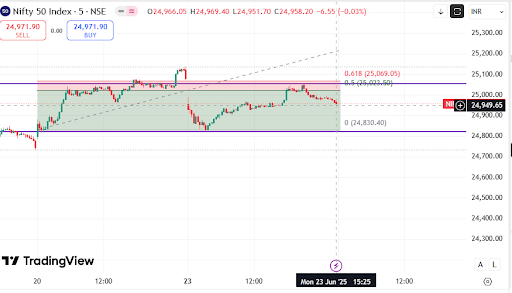
 Nifty 50 intraday chart (5-minute timeframe) based on the image you shared for Monday, 23rd June 2025:


🔍 Chart Overview

  • Instrument: Nifty 50 Index (NSE)

  • Timeframe: 5-Minute

  • Date: 23rd June 2025

  • Price Range: 24,830 – 25,100 approx.


📈 Technical Levels

Support Levels

  1. Support 1: 24,830 (marked as Fibonacci 0 level & bottom of the green zone)

  2. Support 2: 24,900 (recent horizontal consolidation zone and minor bounce area)

Resistance Levels

  1. Resistance 1: 25,023 (Fibonacci 0.5 retracement level)

  2. Resistance 2: 25,069 (Fibonacci 0.618 retracement zone – strong resistance)

  3. Resistance 3: 25,120–25,150 (price rejection zone from earlier candles)


📊 Fibonacci Analysis

  • Fibonacci drawn from low (24,830) to high (~25,150).

  • Price retraced back below 0.5 and 0.618 levels after rejection.

  • Indicates short-term weakness below the 0.618 level (25,069).


📉 Trend & Momentum View

  • Short-Term: Bearish Bias (as price failed to sustain above 0.618 retracement).

  • Price broke down from the rising channel and is testing horizontal support near 24,950–24,900.

  • Candle patterns show selling pressure after hitting the resistance zone.


🎯 Trade Setup Suggestion

🔻 If Shorting (Bearish View):

  • Entry: Near 24,980–25,000 on pullback.

  • Target 1: 24,900

  • Target 2: 24,830

  • Stop Loss: 25,070 (above 0.618 retracement & resistance zone)

🔼 If Buying (Bullish View from Support):

  • Entry: Around 24,900–24,920 (if support holds)

  • Target 1: 25,000

  • Target 2: 25,030–25,070

  • Stop Loss: 24,880 (below strong support)


🕒 Intraday Summary (23 June 2025)

  • High: ~25,150 (morning)

  • Low: ~24,830 (previous session)

  • Current: ~24,950

  • After testing highs, Nifty faced resistance and started to decline, staying below key Fib levels — suggesting profit-booking or short-term correction.


📌 Key Notes

  • Watch for break below 24,900 for downside momentum.

  • Strong bounce only expected if price reclaims 25,070+ on volume.

  • Intraday range: Likely to stay between 24,830 – 25,070 unless a breakout occurs.

Saturday, June 21, 2025

Gold Futures (MCX) overview


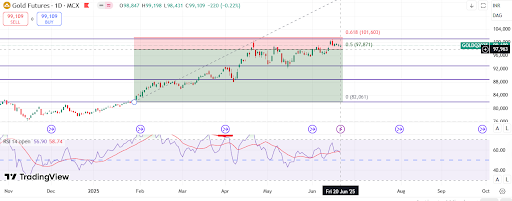
Gold Futures (MCX) daily chart, here's a comprehensive technical analysis covering target, stop loss, support/resistance levels, and views across short, medium, and long term:


🔍 Technical View Overview

📊 Indicators Used:

  • Fibonacci Retracement (from ₹82,061 to approx ₹101,603)

  • RSI (14) – Currently around 58.74 (neutral to mildly bullish)

  • Candlestick Pattern – Showing consolidation near key Fibonacci levels


🧱 Support & Resistance Levels

Level TypePrice (₹)Remarks
Immediate Resistance99,500 – 100,000Psychological & Fibonacci 0.618 level
Major Resistance101,6000.618 Fib level – significant barrier
Immediate Support97,870Fibonacci 0.5 level – strong recent support
Major Support95,000Past consolidation & breakout area
Key Support92,000Last demand zone before major fall begins
Strong Base82,061Fibonacci 0 level – long-term base

🎯 Price Action & Trend Analysis

  • Price is consolidating between 97,800 – 99,500 range.

  • Golden ratio (0.618 @ 101,603) is acting as a strong resistance.

  • RSI is below overbought zone, showing no extreme trend pressure.

  • Trend is bullish but momentum is slowing near the resistance zone.


🧭 Target & Stop Loss

🔹 Short Term (1–2 weeks):

  • View: Sideways to Mildly Bullish

  • Buy above ₹99,500 (breakout confirmation)

  • 🎯 Target: ₹100,800 – ₹101,600

  • 🛑 Stop Loss: ₹97,600

🔸 Medium Term (1–2 months):

  • View: Bullish if sustains above ₹99,500

  • 🎯 Target: ₹103,000 – ₹105,000 (above 0.618 Fib extension)

  • 🛑 Stop Loss: ₹95,000 (below medium-term support)

🔹 Long Term (3–6 months or more):

  • View: Bullish trend intact above ₹92,000

  • 🎯 Target: ₹108,000 – ₹110,000 (Fibonacci extension levels beyond 1.0)

  • 🛑 Stop Loss: ₹92,000 (key structural support)


📈 Conclusion

  • The chart shows healthy uptrend supported by Fib levels.

  • ₹101,600 is the critical breakout level for fresh highs.

  • Current consolidation may lead to a breakout or retest of ₹97,800 zone.

  • RSI and trend indicate bulls still in control, but volume and momentum confirmation are needed for strong upside.

Wednesday, June 18, 2025

NIFTY 50 OVER VIEW


Nifty 50 Index chart you provided (30-minute time frame) with target, stop loss, support-resistance, and views across short, medium, and long term:


🔍 Chart Overview:

  • Timeframe: 30-minute

  • Current Price: 24,881.95

  • Recent High: 25,383.70

  • Recent Low: 23,274.40

  • Key Levels: Fibonacci retracement drawn from swing high to swing low.


📊 TECHNICAL VIEW:

🔵 Support Levels:

  1. 24,720–24,750 (Immediate support – recent consolidation zone)

  2. 23,677.15 (Fibonacci 0.5 level – strong medium-term support)

  3. 23,274.40 (Fibonacci 0.618 level – long-term retracement support)

🔴 Resistance Levels:

  1. 25,000 (Psychological resistance and zone of rejection)

  2. 25,383.70 (Recent swing high and Fibonacci 0 level – strong resistance)


🎯 TARGET & STOP LOSS:

If you are BULLISH (Expecting upside):

  • Entry: Near 24,880–24,900

  • Target 1: 25,000

  • Target 2: 25,383 (swing high)

  • Stop Loss: Below 24,720 (immediate support break)


If you are BEARISH (Expecting downside):

  • Entry: On break below 24,720

  • Target 1: 24,300–24,100

  • Target 2: 23,677.15 (0.5 Fibonacci)

  • Stop Loss: Above 25,000 (resistance zone)


⏳ TIMEFRAME VIEW:

🔹 Short Term (1–7 days):

  • Range-bound between 24,720 – 25,383 unless breakout happens.

  • Bullish if holds above 24,880.

  • Bearish below 24,720.

🔸 Medium Term (2–4 weeks):

  • Sustained move above 25,383 can target 25,700–26,000.

  • Below 23,677, it can slide to 23,274.40, the 0.618 retracement level.

🟣 Long Term (1–3 months):

  • As long as Nifty trades above 23,274, long-term structure remains bullish.

  • If it breaks below 23,274, it may signal deeper correction toward 22,800.


📌 SUMMARY:

TrendEntry LevelTargetsStop Loss
Bullish24,880–24,90025,000 → 25,383Below 24,720
BearishBelow 24,72024,300 → 23,677Above 25,000

Tuesday, June 17, 2025

Aditya Birla Capital Ltd (ABCAPITAL) STOCK OF THE VIEW


FIRST TARGET DONE IT MAKE HIGH  258 18/6/2025


BUY 248-249 TGT 255/260 SL 241  17/6/2025 

Aditya Birla Capital Ltd (ABCAPITAL) based on the chart you provided (30-minute timeframe):


📊 Technical View Summary

🔹 Current Market Price (CMP): ₹248.94

🔹 Trend: Sideways-to-Bullish within a consolidation range

🔹 Chart Pattern: Range-bound with breakout attempt


📈 Support and Resistance Levels

  • Immediate Resistance: ₹251.65 (Fibonacci 0.5 level)

  • Major Resistance Zone: ₹255.30 (Fibonacci 0.618 level and top of red resistance box)

  • Immediate Support: ₹245 (flat base of consolidation and 50 EMA zone)

  • Major Support: ₹236.32 (Fibonacci 0 level – low of the recent swing)


🎯 Target Levels

  • Short-term Target (1–3 days):

    • ₹251.65 → First resistance (Fibonacci 0.5 level)

    • ₹255.30 → Strong resistance (Fibonacci 0.618 level) — ideal breakout target

  • Medium-term Target (1–2 weeks):

    • If the price breaks above ₹255.30 with volume, next possible targets could be:

      • ₹262–₹265 based on projected move from breakout (measured move from range)


🛑 Stop Loss Levels

  • Conservative Stop Loss: ₹245 (just below the 50 EMA and consolidation support)

  • Aggressive Stop Loss: ₹236.32 (recent swing low and Fibonacci 0 level)


📉 RSI Analysis

  • RSI (not visible on chart):
    Assuming based on price behavior and volume — RSI would be near 60–65 (bullish but not overbought). This shows momentum is building, and if it crosses 70 with breakout above ₹255, strong bullish continuation can follow.


⏳ View by Timeframe

TermViewNotes
Short Term (1–3 days)Bullish BiasWatch for breakout above ₹251–₹255 zone
Medium Term (1–2 weeks)Bullish if breakout confirmsTarget ₹262–₹265
Long Term (2+ weeks)Neutral to BullishNeeds to sustain above ₹255 for trend continuation

Strategy Suggestion

  • Buy Entry Zone: ₹247–₹249

  • Target: ₹251.65 / ₹255.30 / ₹262

  • Stop Loss: ₹245 (tight) or ₹236.32 (safe)

📌 Confirmation needed: Watch for volume spike and RSI above 70 to confirm breakout above ₹255.

Monday, June 16, 2025

HDFC LIFE INS CO LTD STOCK OF THE VIEW


HDFC LIFE INS CO LTD (NSE) with a 30-minute timeframe and key indicators like Fibonacci retracement, moving averages, and support/resistance levels, here is a complete technical analysis including target, stop loss, RSI insights, and views for short, medium, and long term:


🔍 Chart Overview:

  • Current Price: ₹772.70

  • Key Fibonacci Levels:

    • 0%: ₹740.25 (Recent Swing Low)

    • 50%: ₹781.50 (Near-Term Resistance)

    • 61.8%: ₹791.25 (Strong Fibonacci Resistance Zone)

  • Support Zone: ₹740–₹750

  • Resistance Zone: ₹781–₹791

  • Moving Averages:

    • Blue Line (20 EMA): Short-term trend indicator

    • Red Line (200 EMA): Long-term trend indicator


📈 Technical View:

Support Levels:

  • Strong Support: ₹740 – Previous swing low and base of current rally

  • Intermediate Support: ₹755 – Near recent consolidation zone

Resistance Levels:

  • Immediate Resistance: ₹781.50 (Fibo 0.5 level)

  • Major Resistance: ₹791.25 (Fibo 0.618 level – Golden Ratio)


💡 RSI Analysis:

  • Although RSI is not shown in the image, based on price structure:

    • Price has moved up from the ₹740 base.

    • Likely, RSI is approaching overbought zone (>70) if not already there.

    • Watch for bearish divergence if price continues up while RSI flattens.


🎯 Targets and Stop Loss:

📌 Short-Term (1–7 days):

  • Target: ₹781 (Fibonacci 0.5 resistance)

  • Aggressive Target: ₹790–₹792 (Fibonacci 0.618 zone)

  • Stop Loss: ₹762 (below recent breakout level)

📌 Medium-Term (1–3 weeks):

  • Target: ₹800–₹810

  • Stop Loss: ₹750 (previous support cluster)

📌 Long-Term (1–3 months):

  • If the stock sustains above ₹792 and breaks ₹810:

    • Target: ₹840–₹860 (based on prior highs and breakout projections)

    • Stop Loss: ₹730 (major structure breakdown)


📊 Summary Table:

TermTarget RangeStop LossRemarks
Short Term₹781 – ₹792₹762Watch for RSI overbought reversal
Medium Term₹800 – ₹810₹750Needs volume confirmation
Long Term₹840 – ₹860₹730Only if ₹810 is crossed decisively

🧠 Strategy Recommendation:

  • 📉 If RSI is above 70, avoid fresh longs; wait for pullback.

  • 🛑 Keep strict stop loss around ₹762 for short-term trades.

  • 🔄 If price consolidates near ₹770–₹780 with volume, breakout toward ₹790–₹800 likely.

INDUSIND BANK FUTURES STOCK OF THE VIEW

  INDUSIND BANK FUTURES (1-Minute Chart) 🕰 Chart Time: Fri, 27 June 2025 at 14:35 📊 Technical Overview: Current Price: ₹865.30 Day's H...