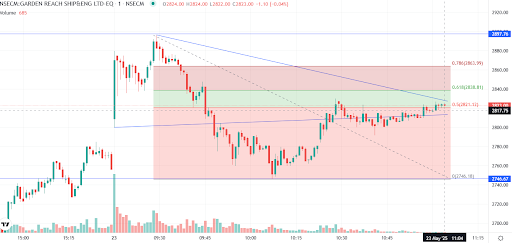
Garden Reach Shipbuilders & Engineers Ltd (NSE: GARDENREACH) on a 1-minute timeframe:
🔑 Key Levels: Resistance Levels:
2821 (0.5 Fibonacci Level): Immediate resistance.
2838 (0.618 Fib): Strong resistance; breakout above this may suggest bullish continuation.
2864 (0.786 Fib): Next major resistance.
2897: Horizontal resistance level near recent high.
Support Levels:
2800 (trendline + psychological round level): Short-term support.
2746 (0 Fibonacci Level): Strong support and recent low.
⚠️ Risk Levels: If price breaks below 2800, risk of further downside increases.
Stop-loss for long trades can be considered around 2746, depending on entry.
💹 Potential Support/Resistance Zones: Support: 2800, 2746
Resistance: 2821, 2838, 2864, 2897
📈 Momentum: Price is attempting to break out of a descending triangle pattern.
Currently testing the 0.5 Fibonacci retracement and trendline resistance.
Volume is slightly increasing near the breakout, which is a positive sign.
📍 Estimated Direction: Bullish bias if price sustains above 2821 and breaks trendline convincingly.
Bearish bias if price fails to hold above 2800 and breaks down below recent support.
🕒 Timeframe: 1-Minute Chart (Intraday): Ideal for short-term scalping or intraday decision-making.
Consider confirming direction on 5-minute or 15-minute charts for more conviction.
🔍 Technical Pattern: Descending Triangle: Typically a bearish continuation pattern, but can break upward if buyers take control.
Fibonacci Retracement Analysis: Retracement from the recent swing high (~2864) to low (~2746), and price is currently around the 50% retracement level.


No comments:
Post a Comment