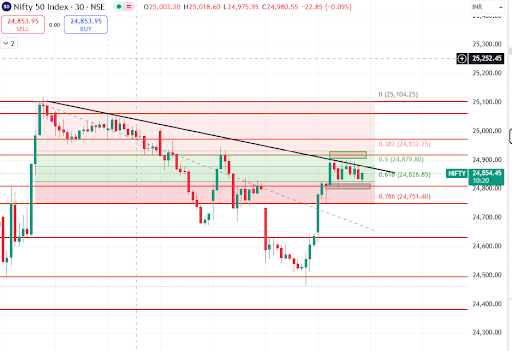
Nifty 50 Index chart you provided (30-minute time frame):
Technical Analysis Summary 🟩 Key Levels:
Immediate Resistance: ~24,880–24,932 (Fibonacci 0.5 and 0.382 levels, also near the downtrend line).
Immediate Support: ~24,826 (Fibonacci 0.618 level).
Major Support: ~24,751 (Fibonacci 0.786 level).
Major Resistance: ~25,104 (recent high), ~25,252.
🚨 Risk Level:
Current price (~24,854) is near a confluence of resistance (trendline + 0.5 Fib).
High risk for longs unless price breaks above 24,932 decisively.
📉 Potential Support:
24,826 (Fib 0.618 level and previous consolidation).
24,751 (Fib 0.786 level) – strong support if breakdown occurs.
📈 Potential Resistance:
24,932 (Fib 0.382 and trendline).
25,104 (swing high, major hurdle).
📊 Momentum:
Momentum is mildly bullish as price is forming higher lows.
Still under pressure due to downtrend line resistance and failure to break above 0.382 Fib.
📍 Estimated Direction:
Neutral to Mildly Bearish in short term unless 24,932 is breached.
If 24,932 is broken with volume, possible upside towards 25,104–25,252.
Breakdown below 24,826 may lead to test of 24,751.
🕒 Time Frame:
30-Minute Chart: Intra-day to short-term swing.
📐 Technical Pattern:
Descending Triangle resistance being tested.
Potential inverse head and shoulders forming if price holds above 24,826 and breaks above 24,932.
Consolidation zone between 24,826–24,932.


No comments:
Post a Comment