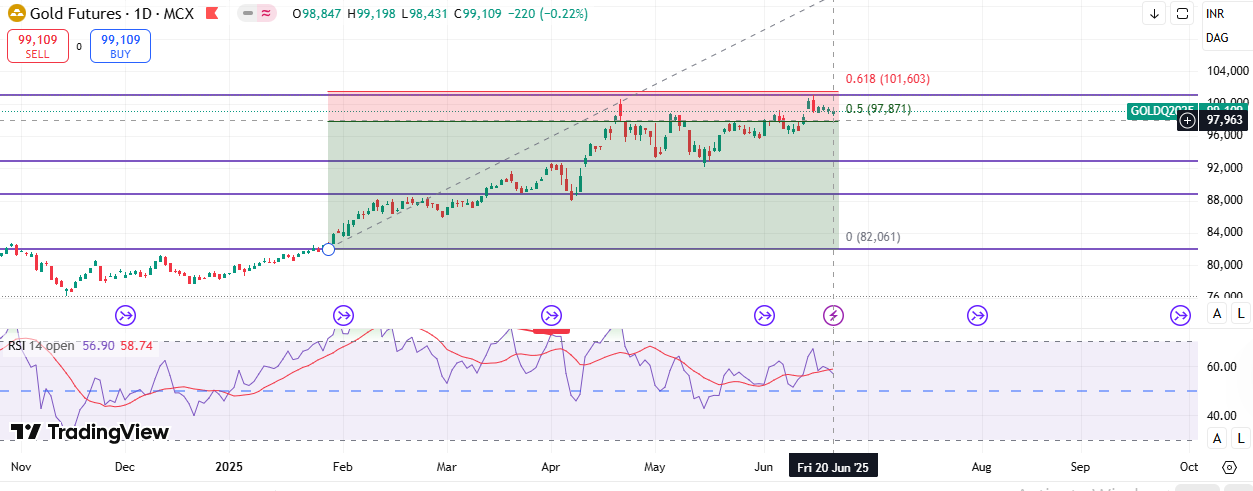
WIPRO LTD (NSE) with Fibonacci retracement, volume, and oscillator analysis, here's a detailed technical view including target, stop-loss, and support/resistance levels:
🔍 Technical Setup Overview: Price: ₹261.55 (as of last candle)
Fibonacci Retracement Levels:
0.382: ₹255.70 (First support)
0.5: ₹253.20 (Second support)
0.618: ₹250.70 (Third support)
0.786: ₹247.10 (Strong support)
Resistance:
Immediate: ₹263.85 (recent high and Fibonacci origin)
Strong: ₹268–270 zone (previous rejection area)
🎯 Trade Setup (Bullish View): The stock has broken above a sideways consolidation range on good volume, with a strong bullish move towards the Fibonacci 0 level (₹263.85). This suggests momentum continuation is likely.
✅ Target (Upside) Levels: T1: ₹263.85 (immediate resistance and previous high)
T2: ₹268.50–270.00 (psychological resistance + past supply zone)
T3: ₹275.00+ (if breakout sustains with volume)
🛑 Stop-Loss: SL1 (tight): ₹255.70 — below 0.382 Fib and minor support
SL2 (moderate): ₹253.20 — below 0.5 Fib and breakout candle low
SL3 (deep): ₹250.00 — if you expect a bounce from golden ratio (0.618)
📉 Support Levels (Buy Zones): ₹255.70 – 0.382 retracement + minor demand zone
₹253.20 – 0.5 retracement, strong reaction seen previously
₹250.70 – golden ratio (0.618), strong institutional buying possible
📊 Volume & Momentum: Volume: Increasing on green candles — confirms breakout strength.
Oscillator (likely Stochastic or Williams %R): Recently overbought, now cooling — indicates short-term pullback possible before next move.
📌 Strategy Suggestions: 🔼 If Holding Long: Book partial profits at ₹263.85
Trail SL to ₹255.70 after breakout confirmation
Ride toward ₹270–275 on strength
🔽 If Planning Fresh Entry: Wait for a dip to ₹255–253 for better risk-reward
Buy near support with SL below ₹250
Target same levels as above
⚠️ Watch Out: If price breaks below ₹250.70 with volume, trend may reverse.
Sideways movement near resistance may lead to false breakouts.
updated technical analysis for WIPRO LTD from the 2-hour chart, now including potential upside and downside in % terms based on support, resistance, and Fibonacci levels:
🔢 Current Price: ₹261.55 (as of June 12, 2025) 📈 Upside Potential (from CMP ₹261.55) Target Price Level (₹) Potential Upside (%) Comment T1 (Immediate) ₹263.85 +0.88% Near-term resistance T2 (Next) ₹268.50 +2.66% Prior swing high T3 (Stretch) ₹275.00 +5.15% Upper resistance zone
📉 Downside Risk (from CMP ₹261.55) Stop-Loss Level Price (₹) Downside (%) Reason SL1 (Tight) ₹255.70 -2.23% Fib 0.382 & minor support SL2 (Medium) ₹253.20 -3.19% Fib 0.5 & recent breakout zone SL3 (Wide) ₹250.70 -4.14% Fib 0.618 (golden ratio) Max Risk Zone ₹247.10 -5.52% 0.786 Fib — trend failure line
🧭 Risk-to-Reward Summary Entry at ₹261.55 SL at ₹255.70 Target at ₹268.50 Risk: 2.23% Reward: 2.66% R:R ≈ 1.2:1
Entry at ₹261.55 SL at ₹253.20 Target at ₹275.00 Risk: 3.19% Reward: 5.15% R:R ≈ 1.6:1
🧠 Conclusion If you’re already holding: Consider booking partial profits near ₹263.85 and hold for ₹268.5–275 with trailing stop-loss.
If looking to enter: A pullback to ₹255–253 gives a better R:R with limited downside (~3%) and upside potential of ~5%.


No comments:
Post a Comment