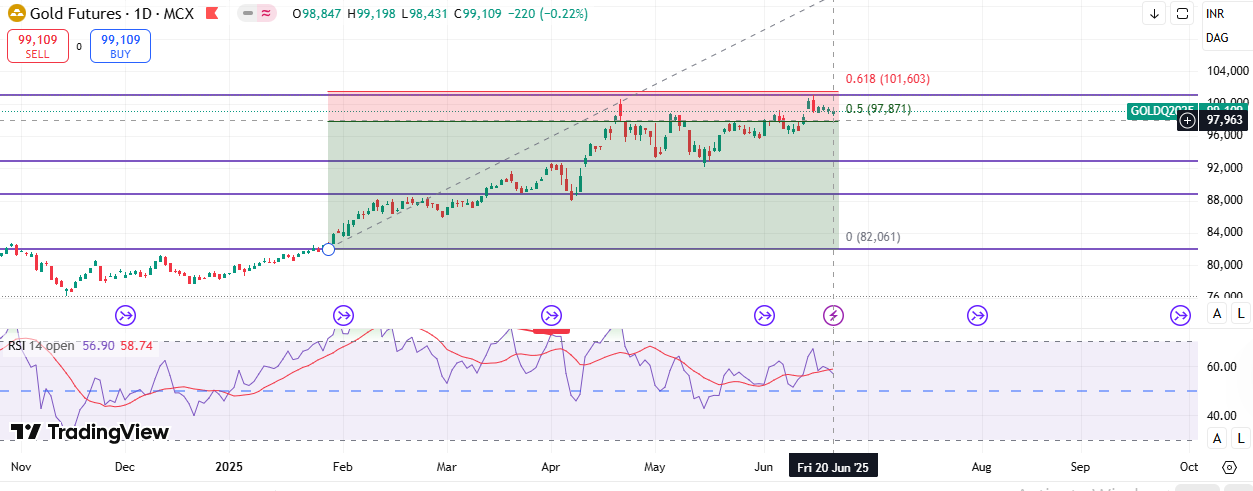
NIFTY 50 Technical Analysis (as of 9th June 2025, CMP: 25,103.20) CLOSE Based on the 5-minute chart with Fibonacci retracement, here’s a detailed analysis:
🔍 Current Price (CMP): 25,103.20 🕒 Time Frame: Intraday to Short-Term (based on 5-min chart) 📊 Technical Levels (Fibonacci Analysis): Support Levels:
Fib 0.618: 25,040.75 (strong retracement support)
Fib 0.5: 24,973.00 (mid-level, neutral support)
Fib 0.382: 24,905.25 (if breaks, may turn bearish)
Resistance Level:
Fib 0.786: 25,137.25 (immediate resistance zone)
✅ TRADE SETUP (INTRADAY) 🔹 Buy Above: 25,137 (if breakout happens with volume)
Target 1: 25,200
Target 2: 25,250
Stoploss: 25,040 (below 0.618 Fib)
Potential Upside: ~0.6% – 1.0%
View: Bullish breakout if price sustains above 25,137 with volume confirmation.
🔻 Sell Below: 24,973 (if breaks 0.5 Fib and sustains)
Target 1: 24,905
Target 2: 24,850
Stoploss: 25,137
Potential Downside: ~0.8% – 1.0%
View: Bearish breakdown below 0.5 & 0.382 Fib level confirms weakness.
📌 Current Zone Analysis (CMP: 25,103.20): Trading between Fib 0.618 (25,040) and Fib 0.786 (25,137).
Market is consolidating in a narrow range.
Wait for a decisive breakout (above 25,137) or breakdown (below 24,973) before initiating a trade.
📈 Strategy Summary: Action Entry Target(s) Stop Loss Risk:Reward Bias Buy Above 25,137 25,200 / 25,250 25,040 ~1:2 Bullish Sell Below 24,973 24,905 / 24,850 25,137 ~1:2 Bearish
Short-Term, Medium-Term, and Long-Term Technical View of NIFTY 50 based on the current chart and broader market trends:
📅 1. SHORT TERM VIEW (1–5 Days) Current CMP: 25,103.20 Chart Basis: 5-minute intraday Fibonacci levels
🔸Trend: Sideways to Mildly Bullish Price is consolidating between 25,040 (Fib 0.618) and 25,137 (Fib 0.786).
Sustained move above 25,137 can lead to bullish momentum.
Breakdown below 24,973 can trigger short-term weakness.
🔸Strategy: Buy above 25,137 → Target: 25,250 | SL: 25,040
Sell below 24,973 → Target: 24,850 | SL: 25,137
🔸Short-Term Resistance: 25,137 / 25,200 🔸Short-Term Support: 25,040 / 24,973 📆 2. MEDIUM TERM VIEW (1–3 Weeks) Chart Basis: Hourly & Daily trend (not shown but inferred)
🔸Trend: Bullish Bias Continues NIFTY has been in a strong uptrend, forming higher highs and higher lows.
As long as it stays above 24,850–24,900, medium-term trend remains intact.
Strong buying zone: 24,800–24,900
If breaks above 25,250–25,300, next leg can start toward 25,500+
🔸Medium-Term Targets: Target 1: 25,400
Target 2: 25,550
Stoploss: Closing below 24,850
📆 3. LONG TERM VIEW (1–3 Months & Beyond) Chart Basis: Daily & Weekly charts
🔸Trend: Strongly Bullish (New Highs in Sight) NIFTY has broken out of major previous highs and sustaining above.
As long as it holds 24,500, structure is bullish.
Next major milestone in long term is around 26,000–26,200.
🔸Long-Term Targets: Target 1: 25,800
Target 2: 26,200
Stoploss: Closing below 24,500
📊 Summary Table: Time Frame Trend Targets Stop Loss View Short Term Sideways–Bullish 25,200 / 25,250 25,040 / 24,973 Watch breakout above 25,137 Medium Term Bullish 25,400 / 25,550 24,850 Buy on dips Long Term Strongly Bullish 25,800 / 26,200 24,500 Trend intact, higher highs possible


No comments:
Post a Comment