Nifty 50 Intraday Chart you shared step by step with Target, Stop-Loss, Support/Resistance, and Pivot Levels.
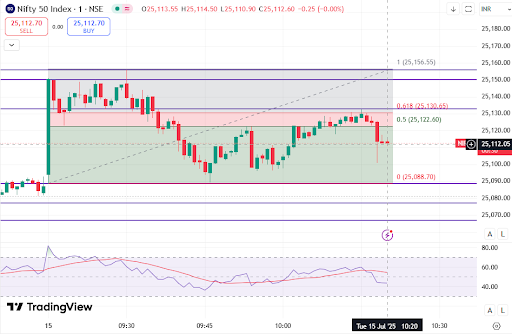
🔍 Technical View Current Price: 25,112.05
Fibonacci Levels:
0.618 Retracement: 25,130.65 (Resistance)
0.5 Retracement: 25,122.60 (Current support turning weak)
0 Retracement: 25,088.70 (Major support)
RSI Indicator: Currently trending down, showing slight bearish momentum.
✅ Support & Resistance Immediate Resistance:
25,122 – 25,130 (Fibo zone, selling pressure)
25,156 – 25,160 (Swing High Resistance)
Immediate Support:
25,105 – 25,088 (Fibo 0 level + psychological support)
Below this, next support ~ 25,060
🎯 Pivot Levels Using standard pivot calculation (based on the high-low-close of previous session):
Pivot Point (P): ~25,122
R1: 25,145
R2: 25,156
S1: 25,105
S2: 25,088
Currently, price is testing Pivot Point, so next move will decide direction.
📊 Price Action Outlook Price failed to hold above 0.618 retracement (25,130) → indicates weakness.
RSI is below 50 and sloping down → bearish bias.
If 25,105 breaks, price may slide to 25,088 (next support).
📌 Trading Plan 🔹 Short-Term View (Intraday / 1-2 days) Bias: Mildly Bearish unless price reclaims 25,130
Sell Below: 25,105
Target 1: 25,088
Target 2: 25,060
Stop Loss: 25,130
Buy Above: 25,130
Target 1: 25,145
Target 2: 25,156
Stop Loss: 25,105
🔹 Medium-Term View (1 week) As long as 25,060 holds, the broader trend remains range-bound bullish.
Upside Breakout: Above 25,160 → next target 25,250+
Downside Break: Below 25,060 → next support 24,950
🔹 Long-Term View (1 month+) The larger trend remains bullish as long as price is above 24,800-24,900 zone.
Long-term investors should watch 25,200-25,300 as a major breakout zone.
✅ Quick Summary Immediate Trend: Slight bearish
Key Support: 25,105 → 25,088
Key Resistance: 25,130 → 25,156
Best Strategy Now:
Wait for a breakout from 25,105-25,130 range before entering
Intraday traders can scalp between support/resistance


No comments:
Post a Comment