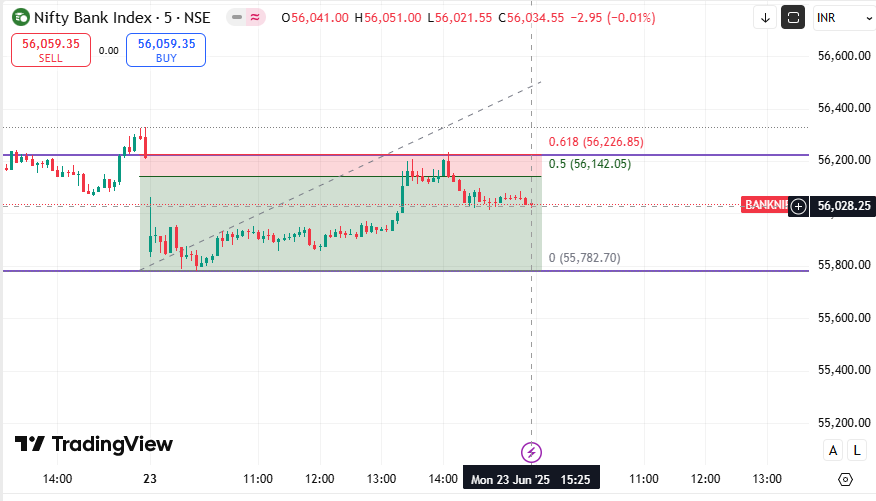
Bank Nifty 5-min chart you provided with Fibonacci retracement levels drawn, here is a complete technical analysis of the current market situation:
📊 Current Market Price (CMP): 56,839.60 🔍 Technical Setup Overview Recent move shows sharp upside from 55,556.65 to 57,058.35.
Current price is near 61.8% Fibonacci retracement level (56,737), which is a strong technical support zone.
Price has retraced from the top and is now consolidating.
✅ Buy or Sell? ✅ Buy Recommendation (Intraday to Short-Term Swing) Since the price is:
Near the 61.8% retracement, often a reversal zone,
Holding above the 56,511 level (50% fib), This setup favors a buy trade for a bounce toward resistance.
🎯 Trade Setup 🔼 Entry (Buy Range): 56,800 – 56,850
🎯 Target Levels: Target 1: 57,058 (Fib 78.6% level)
Target 2: 57,200 (Psychological & likely extension level)
❌ Stop Loss: Below 56,511 (50% fib level)
Safe stop loss: 56,480
📈 Potential Upside %: From 56,840 to 57,200 = 360 pts ≈ 0.63%
⏰ Time Frame: Intraday to Short-term swing (1–2 sessions)
📐 Key Technical Levels Summary: Level Type Price CMP 56,839.60 Support 1 56,737 (Fib 61.8%) Support 2 56,511 (Fib 50%) Resistance 1 57,058 (Fib 78.6%) Target 2 / R2 57,200 Stop Loss 56,480
📌 Conclusion: Buy Bank Nifty at CMP with SL of 56,480 for a target of 57,058 – 57,200. Strong bounce expected from fib support zone. Risk-reward ratio is favorable for a quick upside.
Bank Nifty (CMP: 56,839.60) outlook for Short Term, Medium Term, and Long Term based on price action, Fibonacci levels, and trend structure:
🔍 Technical Context Summary (From Chart): Strong rally from 55,556 to 57,058.
Current price is near 61.8% retracement support, indicating a possible base building zone.
Structure remains bullish unless price breaks below 56,500.
⏱️ 1. Short-Term View (1–5 days) ✅ Trend: Consolidation with bullish bias 🔼 Buy Zone: 56,800 – 56,850 🎯 Targets: T1: 57,058 (Resistance)
T2: 57,200 (Extension/resistance zone)
❌ Stop Loss: Below 56,480 ⚠️ Trigger for Trend Reversal: Break below 56,286 📈 View: Expect bounce from 61.8% retracement zone. Buy-on-dip strategy is favorable.
📅 2. Medium-Term View (1–3 weeks) ✅ Trend: Bullish continuation if holding above 56,200 🔼 Buy on Dips Zone: 56,000–56,500 🎯 Targets: T1: 57,500
T2: 58,000
❌ Stop Loss: Daily close below 56,000 📈 View: Higher lows forming – if this support holds, medium-term rally toward new highs is likely.
📆 3. Long-Term View (1–3 months) ✅ Trend: Strongly Bullish (Higher high structure intact) 📊 Key Supports: Strong base at 54,800–55,000 zone
Fib base level at 55,556 is crucial
🎯 Potential Upside Targets: T1: 59,000
T2: 60,500 (New All-Time High Possible)
❌ Major Stop Loss (Closing Basis): Below 54,500 📈 View: Long-term structure supports buying on every dip until below 54,500. Economic/political tailwinds can push the index to all-time highs.
📌 Summary Table Time Frame Trend Target(s) Support Zone Stop Loss Short-Term Bullish 57,058 / 57,200 56,737 / 56,511 56,480 Medium-Term Bullish 57,500 / 58,000 56,000 – 56,500 56,000 Long-Term Strong Bullish 59,000 / 60,500 54,800 – 55,500 54,500 (close)


No comments:
Post a Comment